
Loads on the Canadian spot market soars due to economies reopening across Canada
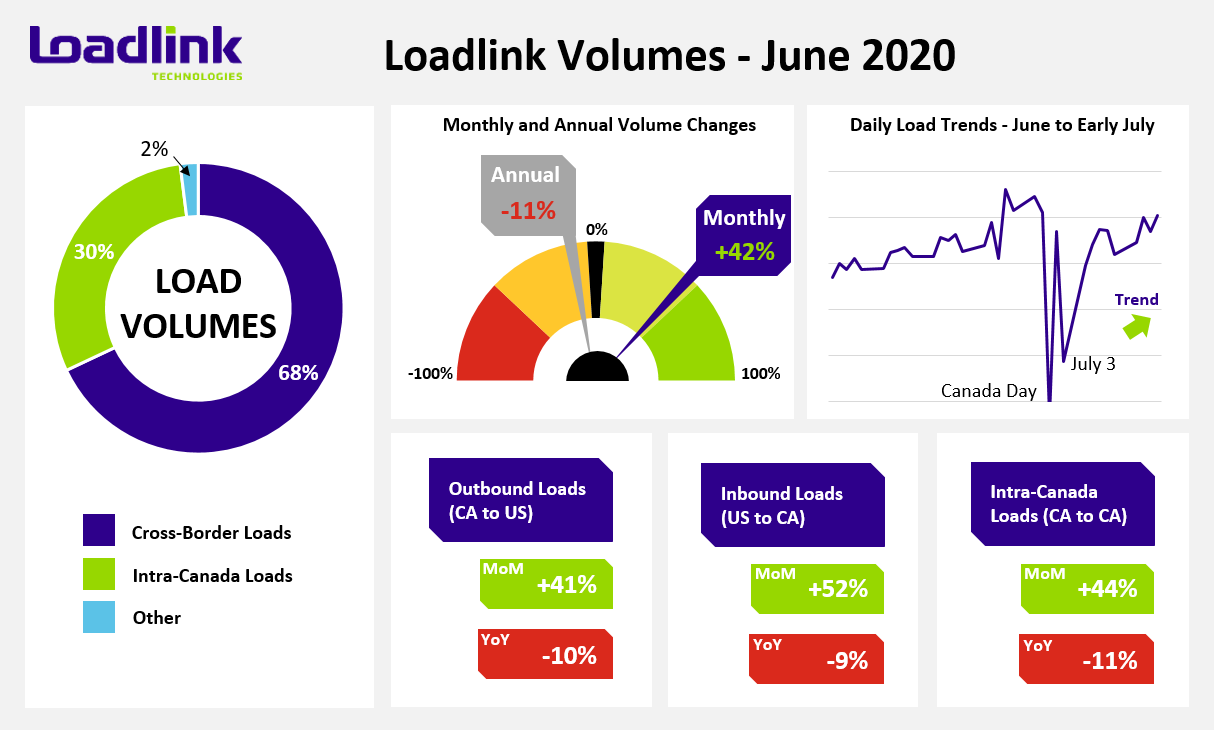
TORONTO – June load volumes on Loadlink’s Canadian spot market spiked following early signs of increased activity in the first week of the month. Month-over-month, overall load volumes on the system increased 42 percent compared to May, and was down 11 percent compared to June 2019. This 42 percent month-over-month increase constituted the largest and most meaningful May to June improvement in Loadlink history. The closest equivalent occurred in June 2009 following the financial crisis of 2008, where June volumes surpassed May by 13 percentage points.
Recovery from the novel coronavirus pandemic continued in June as many Canadian regions entered phase 2 in its reopening, while Ontario took a cautious three-staged approach entering into this phase of economic reopening. Phase 2 appeared to have brought greater activity to the Canadian spot market. July may be an interesting month to monitor as some regions will enter Stage 3 of reopening, which will coincide with a period of time during the summer season when spot freight typically slows. These contrasting dynamics will both positively and negatively affect freight volumes and may be an indicator to whether freight activity resumes at a more ‘normal’ pace for the remainder of the year.
June Highlights
As indicated in May’s Freight Index, load volumes in the first two weeks of June were up nine percent when compared to the latter two weeks of May. The second half of June saw load volumes increase another 10 percent compared to the beginning of the month. Average daily load volumes at the end of June were up a significant 53 percent compared to the start of May, culminating in an overall 42 percent boost in loads from June to May.
Both cross-border and intra-Canadian load volumes saw gains across all regions, regardless of outbound or inbound status. Outbound loads from Canada to the United States increased 41 percent while inbound loads from the USA went up 52 percent. Intra-Canadian load postings were up 30 percent mostly due to a greater quantity of loads originating from Ontario (+36%) and Quebec (+49%), while more loads were destined to Ontario (+36%) and Western Canada (+32%).
Contrary to last month’s gains in load volumes mainly stemming from the Quebec and Alberta markets, the province of Ontario was the big winner in June as many lanes with the largest absolute load volume increases involved the Ontario market. In terms of percentage changes, Alberta’s inbound market remained strong while the Ontario inbound market saw a hefty boost in loads from the USA.
Table 1: Lanes with the largest Load Volume Increases Month over Month
| Market Lane | Rank | Monthly Load Volume Change | Monthly Companies Posting Change |
|---|---|---|---|
| Ontario – Quebec | 1 | +59% | +13% |
| Texas – Ontario | 2 | +102% | +128% |
| Ohio – Ontario | 4 | +81% | +24% |
| Alberta – Manitoba | 6 | +107% | +32% |
| Indiana – Ontario | 8 | +130% | +32% |
| Texas – Quebec | 13 | +92% | +25% |
*Based on lanes with at least 500 postings in June. Ranking is based on how many more loads that lane gained month-over-month, compared to all lanes visible on Loadlink (with minimum 500 postings).
Although May saw strong improvements over April in terms of load volumes on the top 100 busiest lanes on Loadlink, June further surpassed it with 79 lanes seeing a positive month-over-month change. Normally, a few standout lanes of lesser popularity see large surges in load postings in excess of almost doubled volumes, but instead, June saw more consistent, steady gains across most markets with no single lane exceeding a monthly change of plus 49 percent.
As stated in the prior Freight Index, the popular Greater Toronto Area to Montreal lane could be indicative of spot market health for intra-Canadian freight as it comprises substantial markets between two provinces. In the month of June, the GTA to Montreal market saw inbound load postings increased an average of just 11 percent while outbound volumes fell two percent. These lesser monthly changes may indicate that overall improved performance from other markets helped maintain the large load posting difference in June from May.
The following city-to-city lanes saw notable improvements in freight volumes on a monthly basis. Despite being amidst the novel coronavirus pandemic, year-over-year comparisons are actually strengthening as 66 out of the top 100 busiest lanes saw positive year-over-year comparisons.
Table 2: Spotlight City-to-City Lanes with Notable Improvements
| City-to-City Lane | Month-Over-Month Increase | Year-Over-Year Increase |
|---|---|---|
| Taber (AB) – Winnipeg (MB) | 49% | – |
| Toronto (ON) – Windsor (ON) | 45% | 20% |
| Winnipeg (MB) – Vancouver (BC) | 30% | 10% |
| Lethbridge (AB) – Calgary (AB) | 29% | 79% |
| Montreal (QC) – Edmonton (AB) | 22% | 19% |
| Montreal (QC) – Mississauga (ON) | 20% | 27% |
| Toronto (ON) – Atlanta (GA) | 17% | 2% |
The two lanes of Taber to Winnipeg and Toronto to Windsor saw the highest monthly percentage gains among the top 100 busiest lanes. The former lane was driven purely by increased van postings while the latter lane saw a 59 and 52 percent boost in reefer and van postings, respectively. Taber is a well-known agricultural market famous for its corn which is usually ready for harvest in July; however, recent hail storms in the area has damaged early summer crops.
Improved load postings from Taber is most likely a result of a road ban being removed in late May/early June, which was caused by spring front and had prevented access to anywhere from 75 to 90 percent of roads necessary for trucks. This lift on the ban would have allowed trucks and other heavy vehicles access to crucial roads necessary for hauling agricultural products in and out of farmlands.
The Toronto to Windsor market most likely saw increased volumes due to Windsor being the latest market area to transition into the Ontario Phase 2 plan for economic continuity. Restocking of inventories by retailers, restaurants and grocers would have likely driven this boom, as noted by greater reefer and van postings.
July Outlook
Historically, July signals the slowing summer season on the Canadian spot market and freight volumes suffer a small dip. In addition, holidays on both sides of the border at month start also removes some capacity and loads from the market due to lessened business days in the month. With several regions entering Stage 3 of the economic reopening process, increased economic activity may coincide with slower freight demand.
There are a few standout market lanes within the first two weeks that have shown increased load postings. The lane with the largest percentage increase in the first two weeks of July compared to the latter two of June is the Montana to Ontario market, which was up 21 percent. Following behind closely are several cross-border inbound markets to Quebec from the states of New Jersey (+19%), Georgia (+13%) and Florida (+11%).
Declines in cross-border markets were visible on the opposite end of the spectrum, with inbound markets from North Carolina and Texas having the most significant drops in freight. The North Carolina to Quebec and Ontario lanes both saw drops of 50 and 44 percent, respectively. The Texas to Quebec and Ontario lanes both saw an average decrease of 42 percent.
Average Truck-to-Load Ratios
In June, capacity tightened by 27 percent to a ratio of 3.84 from a value of 5.27 in May. Year-over-year, June’s truck-to-load ratio was 16 percent higher compared to a ratio of 3.31 in June 2019. At the time of writing, July’s early truck-to-load ratio has risen significantly by three percent to a value of 3.95, in part due to holidays on both sides of the border at the start of the month.
About Loadlink Indexes
Rate Index data is based on the average spot rates paid by freight brokers and shippers to carriers in the specific lanes where loads are hauled. This data also shows real-time and historical available capacity, and total truck-to-load ratios.
Freight Index data provides insight on Canada’s economy at large, and is a primary resource for the trucking community. The Freight Index accurately measures trends in the truckload freight spot market as its components are comprised from roughly 6,000 Canadian carriers and freight brokers. This data includes all domestic, cross-border, and interstate data submitted by Loadlink customers.
About Loadlink Technologies
Loadlink Technologies helps Canadian transportation companies facilitate the critical movement of goods by trucks through the use of its technology. With decades of propelling innovation and by way of its modernized freight matching, the company helps its members drive better business performance and competitiveness while delivering new levels of customer experiences.