Outbound cross-border and intra-Canadian loads soar on Loadlink as recovering domestic activity boosts overall freight market, signaling bigger things to come in March.
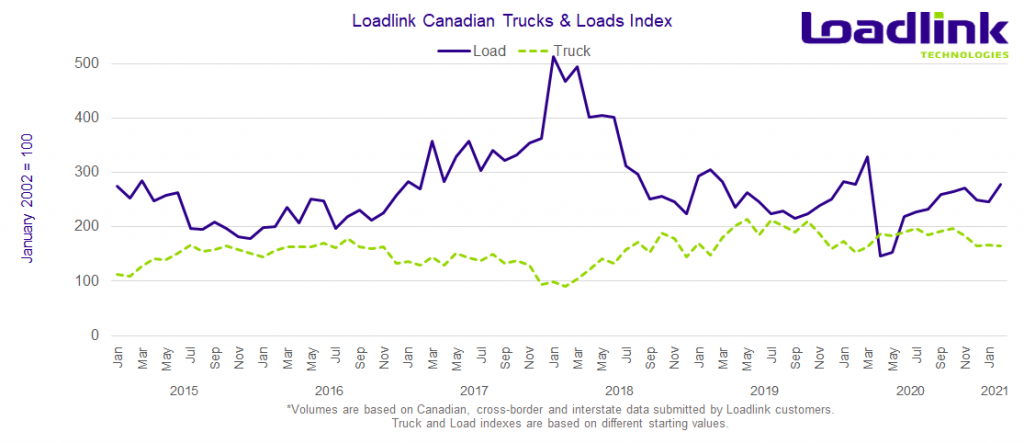
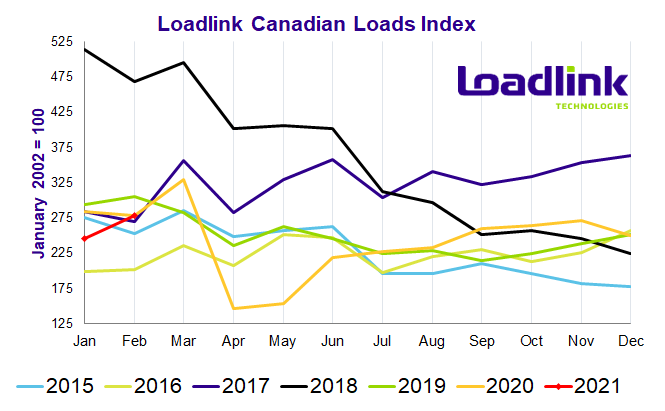
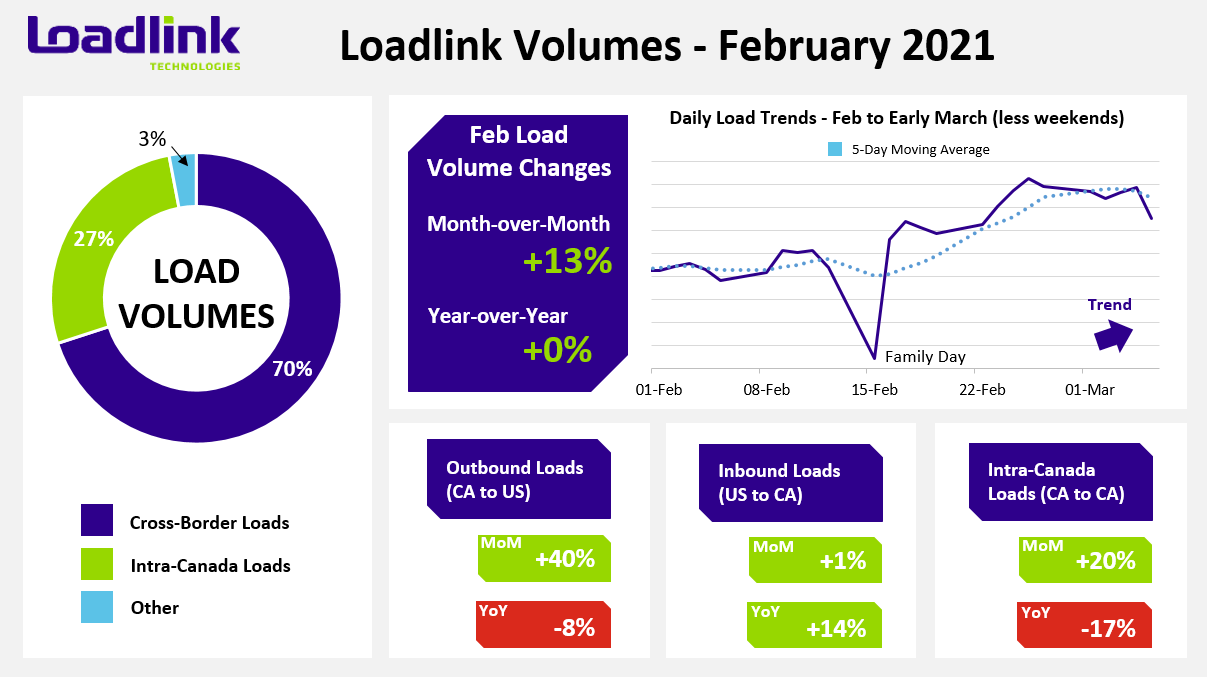
TORONTO – Load volumes on Canada’s spot market saw the largest highly monthly volumes, since March 2020 when the pandemic first began, with load numbers up 13 percent compared to last month. Notably, single-day load volumes reached a peak in February that had not been seen since mid-2018. Year-over-year, there was no change from February 2020. Truck postings remained consistent from January but were up eight percent from February 2020.
FEBRUARY HIGHLIGHTS
- February began the month similar to how January ended with loads trending slightly downwards
- Load volumes in the second week of February ticked up by five percent compared to week one
- Following the Family Day long weekend recognized in most provinces, average daily load volumes spiked 13 percent from week two and jumped another 13 percent in the last week of February
- February 25 had the highest single-day load volumes of any day since mid-July 2018
- Despite less business days in the month, average daily volumes were up 19 percent overall
Loadlink Technologies foresaw the potential rise in volumes in February due to the phased lifting of COVID-19 lockdown restrictions across many communities in Ontario as well as Quebec. The recovery that occurred in the middle of the month coincided with multiple reopening economies across Ontario. Previous domestic lockdowns presented ample opportunity for the spot market to recover once restrictions were lifted. February’s strong freight performance proved this point as domestic loads rose by 20 percent.
Based on recent load volume trends and February’s welcomed recovery in load postings, Loadlink Technologies predicts load volumes to further improve and surpass March 2020 numbers to reach a new monthly high not seen since June 2018. Barring any setbacks or announcements of new COVID-19 lockdowns and/or restrictions on the domestic front, Loadlink’s spot market load volumes may be in for a potential double digit percentage increase month-over-month, while equipment postings may rise but at a lesser rate. This is an opportunity for carriers and brokers alike to begin preparing for a busier season as available loads on Loadlink will keep trucks occupied and as a result, rising spot rates may be on the horizon.

Outbound Cross-border Activity
Outbound cross-border load volumes in February broke a four-month streak of declines with a huge boost of 40 percent more postings from January, but was down by eight percent compared to February 2020. Equipment postings fell three percent from January but were up five percent from February 2020.
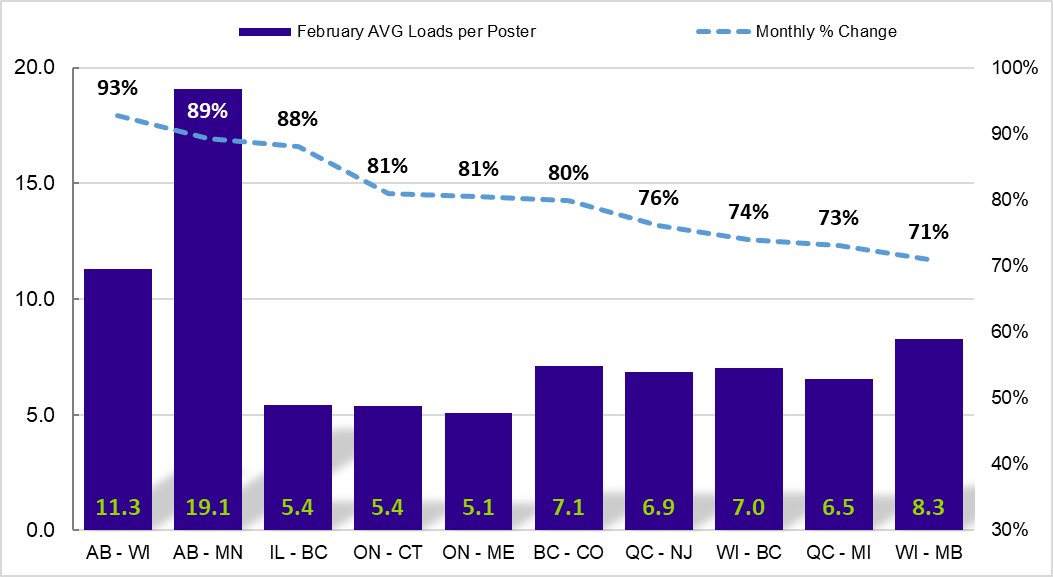
As further evidence of lifted lockdown restrictions fueling the surge in freight activity on Canada’s spot market, Ontario outbound lanes surpassed British Columbia with some of the best performing provincial/state lanes in February. Four out of the top 10 lanes with the largest percentage gains from January originated from the Ontario cross-border outbound market. The inbound markets of Maine, Connecticut, New Jersey, and Massachusetts all saw monthly gains of 138, 99, 95 and 86 percent more loads, respectively. Western Canada continued its strong and consistent performance with the British Columbia to Colorado and Alberta to Minnesota lanes both up an average of 104 percent month-over-month. Recovery in the province of Quebec was also apparent as the inbound markets of Michigan and Virginia narrowly missed out on the top 10 list with an average monthly change of 79 percent.
Inbound Cross-border Activity
The ongoing trend of increasing inbound cross-border load volumes was quelled slightly as February only saw a one percent gain from last month, while on a year-over-year basis, improved 14 percent compared to February 2020. Equipment volumes went up three percent from January and were up four percent from last year. Inbound volumes fell across all major Canadian regions barring Western Canada, which saw 27 percent more loads entering the region and singlehandedly propped up the overall monthly inbound cross-border change to a positive level. All cross-border inbound Western Canada lanes with sufficient volumes in February saw a boost in loads except the California and Arizona to Alberta markets, which saw minor declines of under five percent.
Compared to January when all states delivered more freight to Canada except Connecticut, Nevada, and Utah, February saw roughly only 60 percent of all states show a monthly improvement in outbound volumes. Of the busiest state markets in February, Illinois (-20%), Texas (-8%), Washington (-6%) and Ohio (-5%) all delivered less freight to Canada while California (+12%) and Pennsylvania (+11%) saw better performance. The single lane with the largest percentage increase on Loadlink’s spot market in February belonged to the inbound cross-border lane of Illinois to British Columbia as loads surged 159 percent from January. The next two best performing inbound lanes involved British Columbia as loads from both the Oregon and Wisconsin outbound markets were up 102 and 82 percent, respectively. The traditionally busier outbound markets of Texas and Washington trended similar to Western Canada’s overall better performance of 27 more inbound cross-border loads with an average increase of 28 percent more loads.
Intra-Canadian Activity
February’s overall increase in freight activity was largely in part due to improved domestic load movement, breaking the recent trend seen in the past few months of declining Canadian activity. All major regions in Canada saw improvements in both outbound and inbound volumes. In terms of originating region, Quebec led the charge with 41 percent more loads, followed by Ontario (+19%), then Western Canada (+15%) and Atlantic Canada with only minor gains (+2%). Based on receiving region, Ontario held top spot with 33 percent more loads entering the region, followed by Atlantic Canada (+29%), Quebec (+24%), and lastly, Western Canada with eight percent more loads.
Further demonstrating intra-Canadian improvements’ effect on the spot market’s overall incline in freight, the top three lanes with the largest absolute increase in load postings belonged to the Ontario to Quebec freight corridor. COVID-19 lockdowns in both provinces limited freight flow between the two in recent months, but loosening restrictions opened the floodgates as businesses reopened across many municipalities.

Lane Increases
In February, domestic freight activity held the top spots for best performing lanes on Loadlink’s spot market. Specifically, the Ontario outbound market saw large improvements as opposed to recent months when cross-border inbound freight entering the region occupied the majority of Loadlink’s busiest lanes.
- The Ontario to Quebec corridor highlighted February’s tale of recovery as both the Ontario to Quebec lane and its backhaul pair (QC to ON) were the top two lanes
- Ontario’s busy market and density of freight activity meant nine out of the top 10 busiest lanes involved the province
- The sole non-Ontario lane was held by the Alberta to Manitoba lane which was up 22 percent month-over-month
Table 1: Top 5 Lanes with Largest Absolute Increase in Loads
| Market Lane | Rank | Monthly Load Volume Change |
|---|---|---|
| Ontario – Quebec | 1 | +57% |
| Quebec – Ontario | 2 | +21% |
| Ontario – Ontario | 3 | +15% |
| Ontario – Pennsylvania | 4 | +77% |
| Florida – Ontario | 5 | +42% |
*Based on lanes with at least 500 postings in February. Ranking is based on how many more loads that lane gained month over month, compared to all lanes visible on Loadlink (with minimum 500 postings).
Table 2: Top 5 Lanes with Largest Percentage Increase in Loads
| Market Lane | Rank | Monthly Load Volume Change |
|---|---|---|
| Illinois – British Columbia | 1 | +159% |
| Ontario – Maine | 2 | +138% |
| British Columbia – Colorado | 3 | +115% |
| Oregon – British Columbia | 4 | +102% |
| Ontario – Connecticut | 5 | +99% |
*Based on lanes with at least 500 postings in February. Ranking is based on how large the percentage increase in loads for that lane was compared to all lanes visible on Loadlink (with minimum 500 postings).
Figure 1: Top 10 Lanes in February by Largest % Increase in Average Loads per Poster

The following city-to-city lanes saw notable improvements in freight volumes on a monthly basis. Following January’s improvement from December, February’s top 100 city lanes saw even more lanes improve in load postings. As a result, a total of 78 lanes saw increased month-over-month comparisons, while 68 of the lanes saw positive year-over-year changes.
Table 3: Spotlight City-to-City Lanes with Notable Improvements
| City-to-City Lane | Month-Over-Month Increase | Year-Over-Year Increase |
|---|---|---|
| Vancouver (BC) – Calgary (AB) | 105% | 88% |
| Winnipeg (MB) – Vancouver (BC) | 101% | 69% |
| Nogales (AZ) – Montreal (QC) | 94% | 124% |
| Toronto (ON) – Montreal (QC) | 75% | 71% |
| McAllen (TX) – Toronto (ON) | 44% | 71% |
Average Truck-to-Load Ratios
In February, capacity tightened by 12 percent, reaching a value of 2.61 compared to 2.97 in January. Year-over-year, February’s truck-to-load ratio was eight percent higher compared to a ratio of 2.42 in February 2020.
About Loadlink Indexes
Rate Index data is based on the average spot rates paid by freight brokers and shippers to carriers in the specific lanes where loads are hauled. This data also shows real-time and historical available capacity, and total truck-to-load ratios.
Freight Index data provides insight on Canada’s economy at large, and is a primary resource for the trucking community. The Freight Index accurately measures trends in the truckload freight spot market as its components are comprised from roughly 6,200 Canadian carriers and freight brokers. This data includes all domestic, cross-border, and interstate data submitted by Loadlink customers.
About Loadlink Technologies
Loadlink Technologies helps Canadian transportation companies facilitate the critical movement of goods by trucks through the use of its technology. With decades of propelling innovation and by way of its modernized freight matching, the company helps its members drive better business performance and competitiveness while delivering new levels of customer experiences.
Follow us on Facebook, LinkedIn, and on Twitter.

