

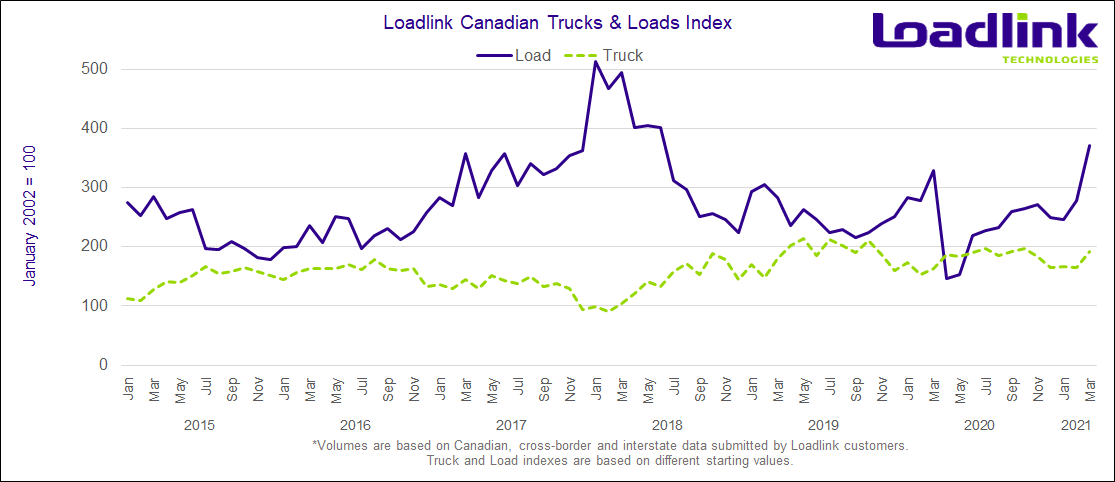
Overall, Loadlink’s load volumes peaked to levels not seen since mid-2018 as first full month out of lockdown for some regions in Ontario, just in time for busier season, saw freight activity swell.
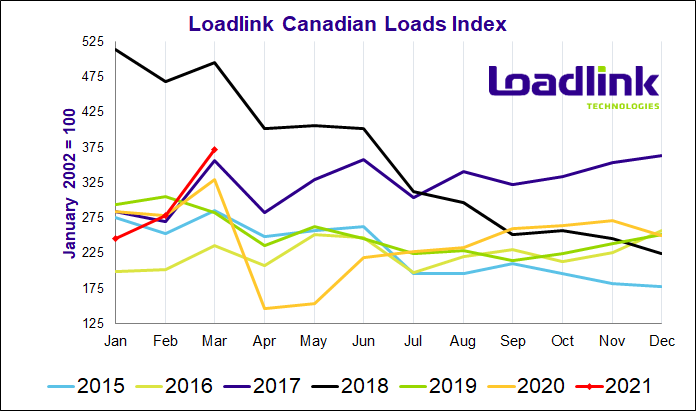
TORONTO – Loadlink’s Canadian spot market saw the highest monthly load volumes since June 2018, at a time when the United States electronic logging device mandates caused decreased truck availability and surging load demand. Compared to February, March load volumes rose 33 percent and were up 13 percent year-over-year from March 2020. The end of lockdown restrictions within certain regions in Canada coupled with March normally seeing slight seasonal boost in loads helped load numbers mark the second strongest March in Loadlink history, while March equipment postings also reached a new all-time high.
MARCH HIGHLIGHTS
- March load volumes peaked during the first week of the month and the freight volumes remained at elevated levels throughout the entire month
- Weekly load volumes following the first week held steady as average daily volumes never dipped below five percent of week one’s average
QUARTERLY HIGHLIGHTS
- Q1 2021 load postings were up 14 percent compared to Q4 2020 while truck postings were down three percent during the same period
- Q1 2021 load postings were up only one percent from the pre-pandemic highs of Q1 2020 while truck postings increased seven percent during the same period
- The average truck-to-load ratio in Q1 2021 was down 13 percent from Q4 2020 indicating a tightening of capacity, but was up eight percent from Q1 2020
As Loadlink Technologies had predicted, load volumes soared following a strong recovery in February. February’s strong end to freight numbers continued into March’s strong gains, which ended up hitting peak volumes not witnessed since mid-2018 when a capacity crunch caused freight to flood the spot market. Reopening economies and expected booms for businesses also added more truck availability onto the spot market as carriers turned to the spot market to capitalize on the influx of freight, marking a new record high for equipment postings in any March on Loadlink’s record. Due to March’s strong overall performance, the first quarter of 2021 exceeded even the first quarter of 2020 (pre-pandemic).
Unfortunately, due to further outbreaks of the novel coronavirus and a third wave hitting Canada, stricter measures have currently been imposed on several provinces with the situation most serious in Ontario (Canada’s most populous province) followed by, Quebec and British Columbia. At the time of writing, early April load volumes dipped slightly as average daily load volumes in the first week were 17 percent lower than the last week of March with the Easter long weekend causing April to begin the month at a slower pace.
Because of the renewed lockdown restrictions and lesser business days, Loadlink Technologies expects freight activity on the Canadian spot market to fall from March’s outstanding numbers. Loadlink expects mixed results for Canadian spot market activity in April as rapid economic growth in the US coinciding with the produce season will boost load volumes, while ongoing Canadian lockdowns will temper the possible surge in freight. Increasing vaccine availability across Canada and future reopening of the economy post-lockdown will increase consumer spending and economic growth, and may result in an influx of freight similar to the US market.
Outbound Cross-border Activity
Outbound cross-border load volumes in March continued the upward trajectory from February’s improved performance. On a monthly basis, load postings increased 12 percent but were down 16 percent from March 2020. Improvements in equipment numbers were steady and rose at a similar pace of 21 and 23 percent on a month-over-month and year-over-year basis, respectively.
The first three outbound cross-border lanes appeared outside the top 40 with the best improvements originating from Western Canada, which has continued to showcase its strong load numbers since late 2020. The three aforementioned lanes were all destined to Midwest states bordering Ontario, and were as follows: British Columbia to Minnesota (+73%), Alberta to Wisconsin (+72%) and Alberta to Illinois (+62%). The next busiest outbound lane belonged to Ontario to Alabama, which saw 61 percent more postings from February.
Inbound Cross-border Activity
In contrast to February’s flat month for inbound cross-border freight movement compared to January, March saw a significant 42 percent month-over-month surge in freight. March 2020 also boasted impressive load numbers; yet, March 2021’s performance surpassed that as year-over-year inbound cross-border loads were up 33 percent. The net gain in overall load volumes in March 2021 versus March 2020 was most noticeable with the busier inbound cross-border freight movement.
Barring the states of Maine, Arizona and Massachusetts, all originating states delivered more freight into Canada than in February. The Ontario market was the recipient of the most inbound freight as nine out of the top 10 inbound cross-border lanes with the largest boosts in freight were destined to the province. Most notably, outbound loads from Missouri more than doubled with an increase of 113 percent. Other notable outbound markets into Ontario that saw the most gains were Texas (+77%), North Carolina (+75%), Tennessee (+74%) and Virginia (+71%). The last lane of the top 10 belonged to the Quebec inbound market as the outbound market of Texas once again saw huge improvements from February with 84 percent more loads.
Intra-Canadian Activity
March saw intra-Canadian activity rise on a heavier volume similar to inbound cross-border freight, while year-over-year comparisons were relatively flat. Month-over-month, domestic loads were up 36 percent and year-over-year, was up just two percent. All major regions in Canada saw big jumps in both outbound and inbound volumes. In terms of originating region, Ontario had 43 percent more loads, Western Canada was up 36 percent, Quebec gained 49 percent, and Atlantic Canada jumped 60 percent but on lesser total volumes. Based on receiving region, Ontario saw 31 percent more loads, Western Canada received 36 percent more loads (equivalent to their outbound freight gain), Quebec saw the largest gains of 49 percent, and lastly, Atlantic Canada with 12 percent more loads.
Continuing from February’s rise in domestic activity in Ontario and Quebec due to lessened lockdown restrictions, the Quebec to Ontario (+63%) lane held the top spot in terms of overall increased load postings for March. The local Ontario province was also very busy as freight movement was up 41 percent. The consistent Western corridor between Alberta and British Columbia occupied the third busiest domestic lane with 34 percent more loads, followed by two more Western lanes of Alberta to Saskatchewan and the intra-British Columbia market. Alberta to Saskatchewan more than doubled in freight activity from February with 121 percent more loads and was the 24th busiest lane on Loadlink in March.
Lane Increases
In March, the traditionally busy Quebec and Ontario corridor held strong once again occupying the top spot, while the local Ontario market held the same position from February, but saw a larger gain in loads. Vastly superior inbound cross-border activity was once again apparent with the Ontario outbound market receiving more freight, and occupied the remainder of the top five lanes with more loads.
- The Alabama outbound market heated up as the top two lanes with the largest percentage increase from February
- Inbound cross-border lanes occupied the top 16 spots for lanes with the largest percentage gains in load postings
- Of the lanes with sufficient posting volumes, 25 lanes more than doubled in the number of postings in March compared to February (for comparison, there were only four lanes in February that more than doubled in postings from January)
Table 1: Top 5 Lanes with Largest Absolute Increase in Loads
| Market Lane | Rank | Monthly Load Volume Change |
|---|---|---|
| Quebec – Ontario | 1 | +63% |
| Texas – Ontario | 2 | +77% |
| Ontario – Ontario | 3 | +41% |
| Ohio – Ontario | 4 | +43% |
| Georgia – Ontario | 5 | +69% |
*Based on lanes with at least 500 postings in March. Ranking is based on how large the percentage increase in loads for that lane was compared to all lanes visible on Loadlink (with minimum 500 postings).
Table 2: Top 5 Lanes with Largest Percentage Increase in Loads
| Market Lane | Rank | Monthly Load Volume Change |
|---|---|---|
| Alabama – Quebec | 1 | +210% |
| Alabama – Alberta | 2 | +182% |
| Virginia – Quebec | 3 | +178% |
| Oklahoma – Ontario | 4 | +176% |
| Missouri – Alberta | 5 | +156% |
*Based on lanes with at least 500 postings in March. Ranking is based on how large the percentage increase in loads for that lane was compared to all lanes visible on Loadlink (with minimum 500 postings).
Figure 1: Top 10 Lanes in March by Largest % Increase in Average Loads per Poster

The following city-to-city lanes saw notable improvements in freight volumes on a monthly basis. With hugely increased total load volumes from February, March’s top 100 city lanes saw even more lanes improve in load postings. As a result, a total of 81 lanes saw increased month-over-month comparisons, while 72 of the lanes saw positive year-over-year changes.
Table 3: Spotlight City-to-City Lanes with Notable Improvements
| CIty-to-City Lane | Month-Over-Month Increase | Year-Over-Year Increase |
|---|---|---|
| Houston (TX) – Montreal (QC) | 164% | 61% |
| Atlanta (GA) – Mississauga (ON) | 121% | 59% |
| Edmonton (AB) – Vancouver (BC) | 102% | 54% |
| Calgary (AB) – Winnipeg (MB) | 44% | 44% |
| Chicago (IL) – Toronto (ON) | 36% | 17% |
Average Truck-to-Load Ratios
In March, capacity tightened by 13 percent, reaching a value of 2.27 compared to 2.61 in February. Year-over-year, March’s truck-to-load ratio was four percent higher compared to a ratio of 2.18 in March 2020.
About Loadlink Indexes
Rate Index data is based on the average spot rates paid by freight brokers and shippers to carriers in the specific lanes where loads are hauled. This data also shows real-time and historical available capacity, and total truck-to-load ratios.
Freight Index data provides insight on Canada’s economy at large, and is a primary resource for the trucking community. The Freight Index accurately measures trends in the truckload freight spot market as its components are comprised from roughly 6,200 Canadian carriers and freight brokers. This data includes all domestic, cross-border, and interstate data submitted by Loadlink customers.
About Loadlink Technologies
Loadlink Technologies helps Canadian transportation companies facilitate the critical movement of goods by trucks through the use of its technology. With decades of propelling innovation and by way of its modernized freight matching, the company helps its members drive better business performance and competitiveness while delivering new levels of customer experiences.
Follow us on Facebook, LinkedIn, and on Twitter.