

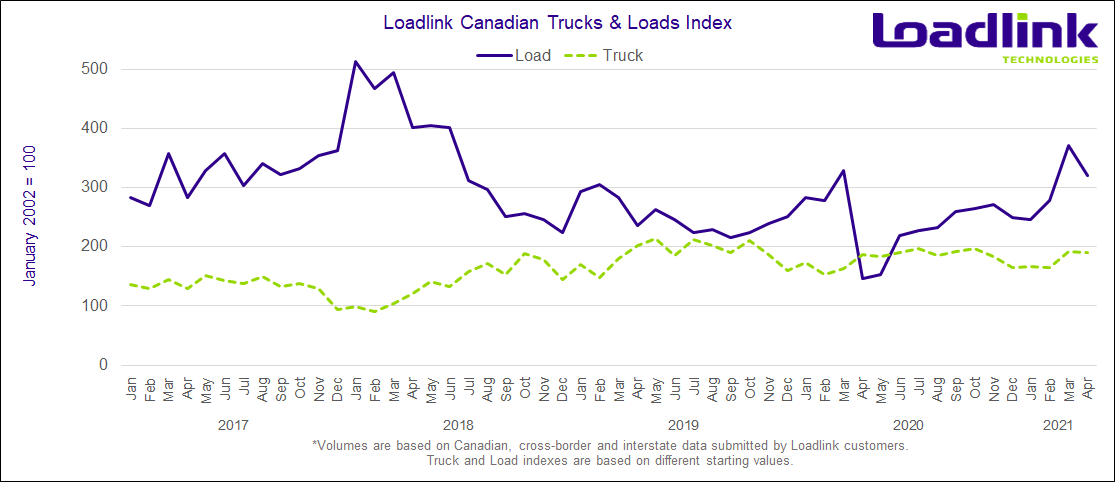
One year since the start of the pandemic first caused drastic declines in freight, the spot market bounced back marked the first month in Loadlink history with a three-figure, year-over-year increase in loads.
TORONTO – Loadlink’s Canadian spot market in April had over double the number of loads available compared to April 2020 when the novel coronavirus pandemic first began. The overall road to recovery for Canada has been arduous, and the pandemic has challenged Canadian trucking companies to rethink how they conduct business in a way that they have not been challenged to do so before. On a monthly basis, April saw loads volumes fall slightly by 14 percent, primarily due to the lesser number of business days compared to March. When adjusted for this, average daily load volumes only fell slightly by five percent, which is in line with the average seasonal decline that usually occurs from March to April. Year-over-year, April 2021 surpassed the previous April’s total by 120 percent.
APRIL HIGHLIGHTS
- Load volumes in the first week of April fell 15 percent from the last week of March
- Load postings recovered slightly in week two by seven percent followed by another subsequent week of increasing volumes by five percent
- The gradual improvement in loads culminated in the last week of April having the highest single week load volumes since the start of the pandemic
Outbound Cross-border Activity
In April, outbound cross-border loads fell 16 percent from March, but were up 54 percent year-over-year compared to April 2020. Equipment postings remained nearly unchanged with just a single percentage point decline, while on a year-over-year basis, increased 12 percent.
Table 1: Most Improved Outbound Cross-Border Lanes in April 2021
| Market Lane | Rank | Monthly Load Volume Change |
|---|---|---|
| Alberta – Utah | 1 | +35% |
| British Columbia – Washington | 2 | +31% |
| British Columbia – Minnesota | 3 | +20% |
| Quebec – Virginia | 4 | +19% |
| British Columbia – Idaho | 5 | +16% |
*Based on lanes with at least 500 postings in April. Rankings are based on lanes with the largest percentage gains from March posting numbers (with minimum 500 postings).
Inbound Cross-border Activity
Inbound loads from across the border saw the biggest monthly decline of 20 percent out of the three freight movement types on Loadlink. When compared to April 2020, inbound cross-border load volumes more than doubled with an impressive 145 percent increase. Equipment numbers remained steady from March at just a one percent increase, but were down three percent from April 2020.
Table 2: Most Improved Inbound Cross-Border Lanes in April 2021
| Market Lane | Rank | Monthly Load Volume Change |
|---|---|---|
| California – Ontario | 1 | +55% |
| Washington – Ontario | 2 | +54% |
| Idaho – Ontario | 3 | +52% |
| Arizona – Ontario | 4 | +46% |
| California – Quebec | 5 | +44% |
*Based on lanes with at least 500 postings in April. Rankings are based on lanes with the largest percentage gains from March posting numbers (with minimum 500 postings).
Intra-Canadian Activity
In April, domestic activity on Loadlink remained unchanged month-over-month, meaning the Canadian spot market continued to hold strong and steady following the substantial gains that had occurred in March. This helped offset the declines seen in cross-border freight movement. On a year-over-year basis, load volumes more than doubled with a 132 percent increase from April 2020. Equipment volumes fell slightly by four percent from March, and were consistent with just a single percentage point decrease year-over-year.
In terms of domestic outbound freight, all regions saw positive growth in April, except for Western Canada. Atlantic Canada and Quebec saw the largest gains of 26 and 17 percent more freight originating from these provinces, respectively. Ontario bumped up slightly with three percent more loads, while Western Canada delivered 11 percent less loads to the rest of the country.
For domestic inbound freight, the opposite occurred; Western Canada was the only freight-receiving region with a positive gain (+1%), while the other regions all received less freight. Ontario received five percent less loads, Quebec lost 10 percent of volumes, and Atlantic Canada received 87 percent less compared to March.
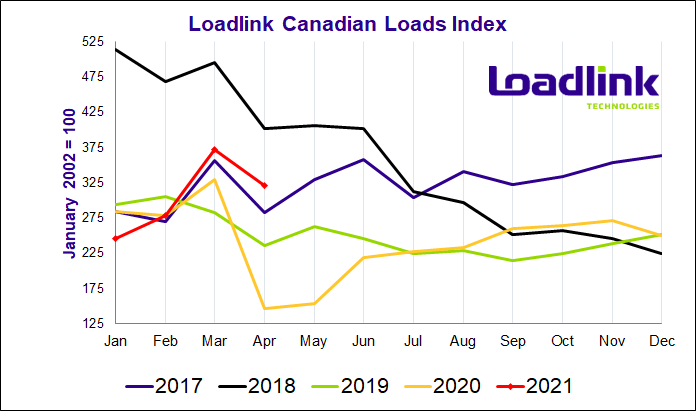
Table 3: Most Improved Inbound Domestic Lanes in April 2021
| Market Lane | Rank | Monthly Load Volume Change |
|---|---|---|
| British Columbia – Ontario | 1 | +55% |
| Alberta – Quebec | 2 | +53% |
| Manitoba – Quebec | 3 | +47% |
| British Columbia – Saskatchewan | 4 | +45% |
| Quebec – Quebec | 5 | +39% |
*Based on lanes with at least 500 postings in April. Rankings are based on lanes with the largest percentage gains from March posting numbers (with minimum 500 postings).
Average Truck-to-Load Ratios
In April, the truck-to-load ratio increased by 15 percent, reaching a value of 2.60 compared to 2.27 in March. This was a result of average daily truck postings increasing by eight percent from March while average load postings dipped five percent. Year-over-year, April’s truck-to-load ratio was 54 percent lower compared to a ratio of 5.64 in April 2020.
About Loadlink Indexes
Rate Index data is based on the average spot rates paid by freight brokers and shippers to carriers in the specific lanes where loads are hauled. This data also shows real-time and historical available capacity, and total truck-to-load ratios.
Freight Index data provides insight on Canada’s economy at large, and is a primary resource for the trucking community. The Freight Index accurately measures trends in the truckload freight spot market as its components are comprised from roughly 6,200 Canadian carriers and freight brokers. This data includes all domestic, cross-border, and interstate data submitted by Loadlink customers.
About Loadlink Technologies
Loadlink Technologies helps Canadian transportation companies facilitate the critical movement of goods by trucks through the use of its technology. With decades of propelling innovation and by way of its modernized freight matching, the company helps its members drive better business performance and competitiveness while delivering new levels of customer experiences.
Follow us on Facebook, LinkedIn, and on Twitter.