
Another consecutive month of triple-digit year-over-year improvements ends with a bang as May held strongest single-day load volumes since April 2018.
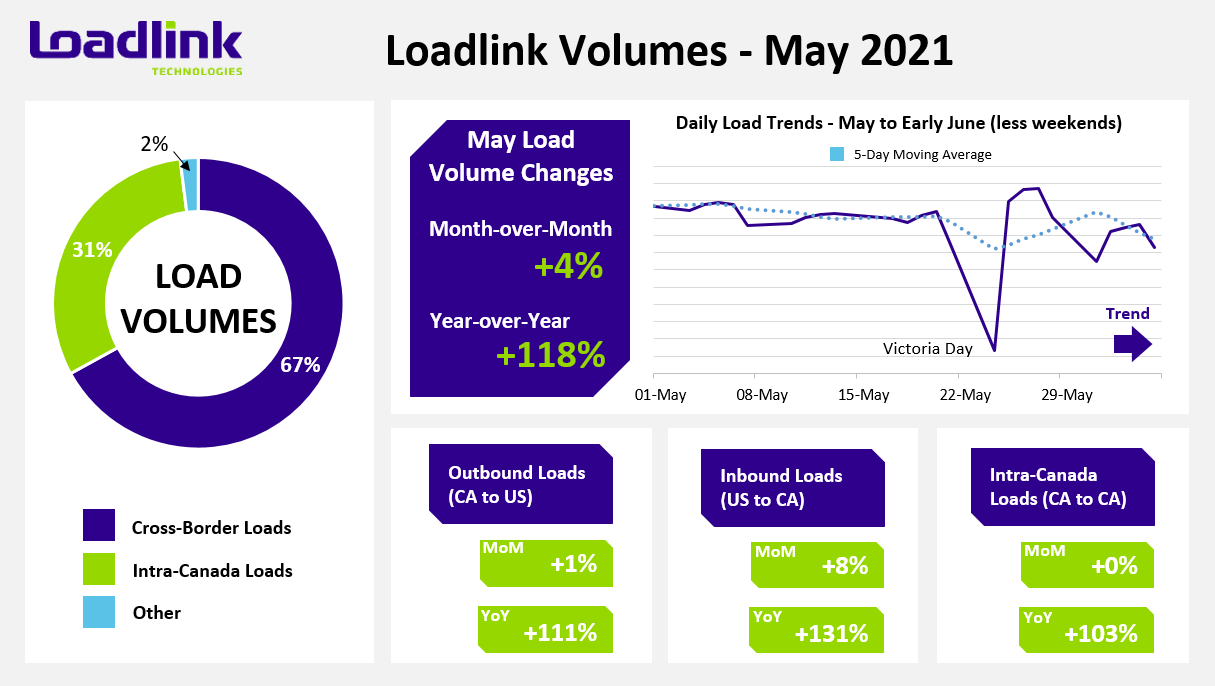
TORONTO – Loadlink’s Canadian spot market load numbers rose slightly by four percent on a monthly basis and more than doubled in volume compared to May 2020 with a 118 percent year-over-year increase. Average daily load volumes in May were the highest since June 2018, beating out March 2021’s average due to the lesser number of business days despite March’s higher total volumes. Year-over-year comparisons continued to be extremely positive considering May 2020 was the second month of the COVID-19 pandemic in Canada at which point the freight market was heavily weakened. Overall, load postings in May 2021 were the second highest in Loadlink history for the month behind record-setting numbers back in 2018.
MAY HIGHLIGHTS
- Load volumes in the first week of May were the second strongest for the month, but were down slightly by two percent from the last week of April.
- Load postings slipped a bit in the following two weeks, with an average of five percent less daily loads compared to week one of May.
- The week following the Canadian Victoria Day holiday saw two back-to-back days of the strongest daily load volumes on Loadlink since late April 2018, culminating in the highest daily average loads in a single week since the pandemic began.
Outbound Cross-border Activity
In May, outbound cross-border loads saw relatively no change from April as posting volumes increased a single percentage point. On a year-over-year basis, loads more than doubled from May 2020 with a 111 percent increase. Equipment postings saw only minor changes as volumes fell just two percent from April, but were up three percent from last May.
Table 1: Most Improved Outbound Cross-Border Lanes in May 2021
| Market Lane | Rank | Monthly Load Volume Change |
|---|---|---|
| Alberta – Illinois | 1 | +58% |
| British Columbia – Texas | 2 | +50% |
| Quebec – Maryland | 3 | +50% |
| Ontario – Connecticut | 4 | +48% |
| Alberta – Texas | 5 | +46% |
*Based on lanes with at least 500 postings in May. Rankings are based on lanes with the largest percentage gains from April posting numbers (with minimum 500 postings).
Inbound Cross-border Activity
An increase in inbound loads entering Canada from across the border was the primary reason for the overall positive monthly gain in total load volumes from April. Inbound cross-border loads increased eight percent from April and were up by 131 percent compared to May 2020. Georgia was the hot state market in May as outbound loads from the market occupied the top two spots, while Ontario and Quebec were the main beneficiaries of improved inbound loads. Equipment numbers decreased on a monthly basis by five percent and were down just three percent year-over-year.
Table 2: Most Improved Inbound Cross-Border Lanes in May 2021
| Market Lane | Rank | Monthly Load Volume Change |
|---|---|---|
| Georgia – Ontario | 1 | +67% |
| Georgia – Quebec | 2 | +61% |
| Michigan – Quebec | 3 | +48% |
| Mississippi – Quebec | 4 | +46% |
| Kentucky – Ontario | 5 | +44% |
*Based on lanes with at least 500 postings in May. Rankings are based on lanes with the largest percentage gains from April posting numbers (with minimum 500 postings).
Intra-Canadian Activity
For the second consecutive month, domestic activity on Loadlink remained unchanged month-over-month with strong intra-Canadian activity continuing for three straight months following very impressive load volumes in March. Alongside the slight positive gains in outbound cross-border loads and better inbound performance, the overall Canadian spot market held strong. On a year-over-year basis, load volumes doubled with a 103 percent increase from May 2020. Equipment volumes rose slightly as there were two percent more equipment postings compared to April and six percent more from May 2020.
Domestic freight originating from Ontario and Western Canada fell three and seven percent, respectively. Atlantic Canada saw no change in freight leaving the region, while Quebec led the nation with an impressive 21 percent more freight delivered out of the province.
For domestic inbound freight, all regions saw declines in freight entering their respective areas except for Ontario. Ontario was the happy recipient of 12 percent more freight compared to the rest of Canada. Western Canada saw five percent less freight while both Quebec and Atlantic Canada received eight percent less. Despite the three other regions receiving less freight, the positive freight movement entering the busier region of Ontario allowed intra-Canadian activity to remain stable.
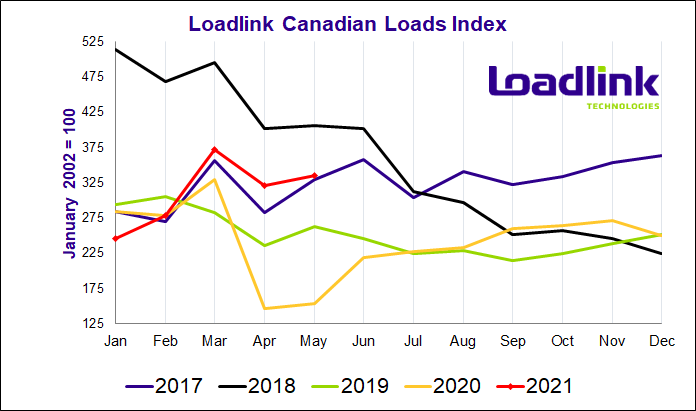
Table 3: Most Improved Inbound Domestic Lanes in May 2021
| Market Lane | Rank | Monthly Load Volume Change |
|---|---|---|
| British Columbia – Saskatchewan | 1 | +42% |
| Ontario – Quebec | 2 | +40% |
| Alberta – Ontario | 3 | +30% |
| Ontario – New Brunswick | 4 | +12% |
| Quebec – Nova Scotia | 5 | +11% |
*Based on lanes with at least 500 postings in May. Rankings are based on lanes with the largest percentage gains from April posting numbers (with minimum 500 postings).
Average Truck-to-Load Ratios
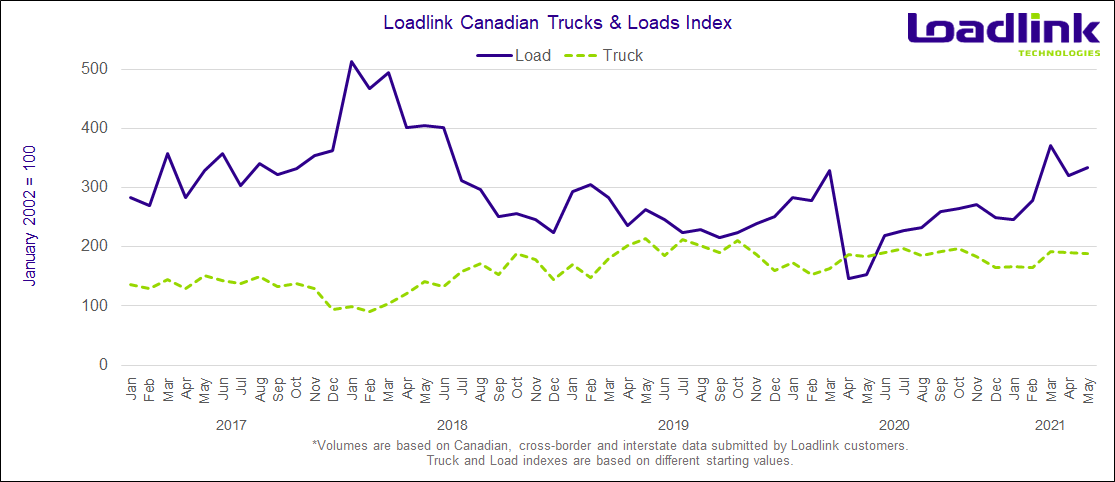
In May, the truck-to-load ratio decreased by five percent, reaching a value of 2.47 compared to 2.60 in April. Year-over-year, May’s truck-to-load ratio was 53 percent lower compared to a ratio of 5.27 in May 2020.
About Loadlink Indexes
Rate Index data is based on the average spot rates paid by freight brokers and shippers to carriers in the specific lanes where loads are hauled. This data also shows real-time and historical available capacity, and total truck-to-load ratios.
Freight Index data provides insight on Canada’s economy at large, and is a primary resource for the trucking community. The Freight Index accurately measures trends in the truckload freight spot market as its components are comprised from roughly 6,200 Canadian carriers and freight brokers. This data includes all domestic, cross-border, and interstate data submitted by Loadlink customers.
About Loadlink Technologies
Loadlink Technologies helps Canadian transportation companies facilitate the critical movement of goods by trucks through the use of its technology. With decades of propelling innovation and by way of its modernized freight matching, the company helps its members drive better business performance and competitiveness while delivering new levels of customer experiences.
Follow us on Facebook, LinkedIn, and on Twitter.