

No change in monthly load volumes as stronger cross-border presence combats less freight activity from Western Canada.
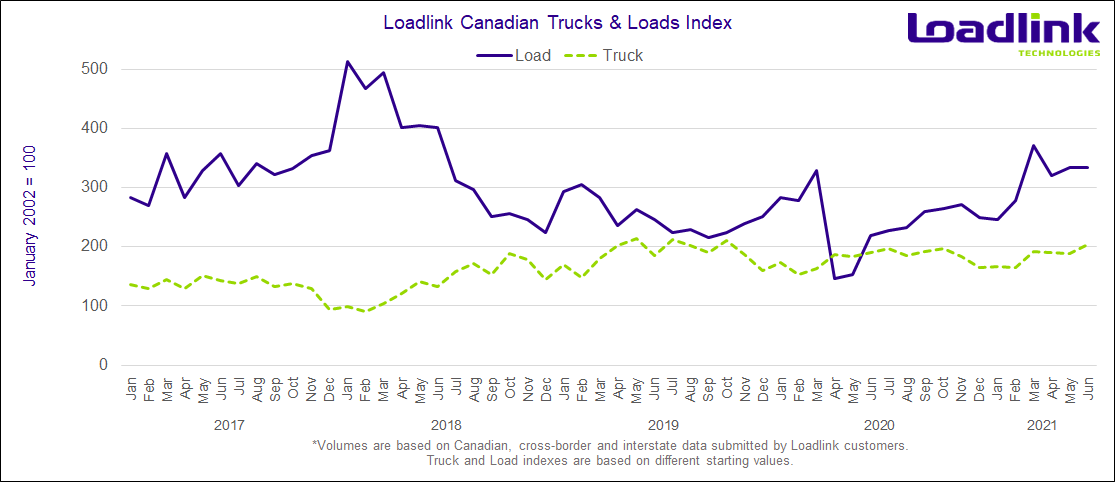
TORONTO – Load volumes in June on Loadlink’s Canadian spot market remained consistent from May as there were no change in volumes on a month-over-month basis. Average daily load volumes fell nine percent compared to May, but the extra business days helped the overall monthly load total stay the same from last month. Year-over-year, load volumes increased by 53 percent from June 2020.
Slightly stronger cross-border activity counteracted a decline in domestic freight movement, mainly due to lesser volumes from Western Canada. Following a strong quarterly showing, the second half of 2021 brings signs of optimism as loosening border restrictions and positive developments on the pandemic front will inch Canada slowly closer to a return to normalcy.
JUNE HIGHLIGHTS
- Consistent load volumes in the first three weeks of the month resulted in average daily postings staying within a three percent range of one another
- When excluding the Canada Day holiday and subsequent day during the last week of June, the final three days of June had the highest volumes for the month, surpassing the daily average of the rest of the month by nine percent
QUARTERLY HIGHLIGHTS
- Load volumes in Q2 2021 surpassed Q1 2021 by 10 percent, also marking the second highest Q2 load volumes in Loadlink history behind Q2 2018
- Compared to Q2 2020, load volumes almost doubled with a 91 percent increase, which is the largest year-over-year comparison across any two quarters in Loadlink history
- Equipment volumes in Q2 2021 were up 11 percent from Q1, marking the second highest Q2 truck volumes behind Q2 2019
- The truck-to-load ratio between Q1 and Q2 of 2021 remained virtually unchanged, resulting in a value of 2.58 in Q2 compared to a value of 2.57 in Q1
Outbound Cross-border Activity
In June, outbound cross-border loads once again saw relatively little change as posting volumes increased by only two percent, compared to a one percent increase last month. On a year-over-year basis, load volumes grew by a more impressive 52 percent. Equipment postings saw slightly larger changes as volumes increased seven percent from May, but were up just five percent from last June.
The province of Quebec was the largest source of increased outbound cross-border freight with 23 percent more from May. Atlantic Canada also saw notable monthly gains at a 16 percent boost in postings. Ontario was up from last month but at a lesser pace of growth with just five percent more loads. Western Canada was the only region with less load postings as postings fell 17 percent.
Table 1: Most Improved Outbound Cross-Border Lanes in June 2021
| Market Lane | Rank | Monthly Load Volume Change |
|---|---|---|
| Quebec – Massachusetts | 1 | +48% |
| Quebec – New York | 2 | +43% |
| Quebec – Indiana | 3 | +35% |
| Ontario – Georgia | 4 | +31% |
| Quebec – Ohio | 5 | +29% |
*Based on lanes with at least 500 postings in June. Rankings are based on lanes with the largest percentage gains from May posting numbers (with minimum 500 postings).
Inbound Cross-border Activity
Inbound cross-border freight movement followed a similar trend as outbound cross-border activity with just a two percent increase in loads from May. On a year-over-year basis, load postings were up 56 percent compared to June 2020. Truck volumes grew nine percent from May and were up five percent compared to June 2020.
Ontario was the only province with less freight (-1%) entering the country, while Western and Atlantic Canada both had the biggest improvement in freight volumes at seven percent month-over-month increases each. Quebec followed suit closely with five percent more cross-border freight entering the region from last month.
Table 2: Most Improved Inbound Cross-Border Lanes in June 2021
| Market Lane | Rank | Monthly Load Volume Change |
|---|---|---|
| Wisconsin – Alberta | 1 | +88% |
| Kentucky – Quebec | 2 | +72% |
| Wisconsin – British Columbia | 3 | +71% |
| Illinois – Manitoba | 4 | +58% |
| Illinois – Alberta | 5 | +56% |
*Based on lanes with at least 500 postings in June. Rankings are based on lanes with the largest percentage gains from May posting numbers (with minimum 500 postings).
Intra-Canadian Activity
After two consecutive months of consistent intra-Canadian performance, freight movement within the country fell just slightly by three percent. On a year-over-year basis, load volumes performed similarly to that cross-border activity with a 51 percent improvement in posting volumes from June 2020. Equipment volumes rose slightly more than cross-border with a ten percent increase compared to May and nine percent year-over-year increase from June 2020.
Domestic freight originating from Ontario and Quebec rose by six and one percent, respectively, being the only two regions with positive gains in outbound freight from May. Both Western and Atlantic Canada were the source of less outbound freight compared to May with 12 and 10 percent less loads, respectively.
Domestic inbound freight followed in-line closely with activity seen on the domestic outbound front. Ontario saw just a five percent improvement in freight volumes from May while Quebec followed behind with just a two percent bump in postings. Western Canada saw 13 percent less freight while Atlantic Canada received eight percent less for the second consecutive month. Despite declining volumes from the West, Saskatchewan showed standout performance as an outbound market with three of the top five intra-Canadian lanes in June originating from the province.
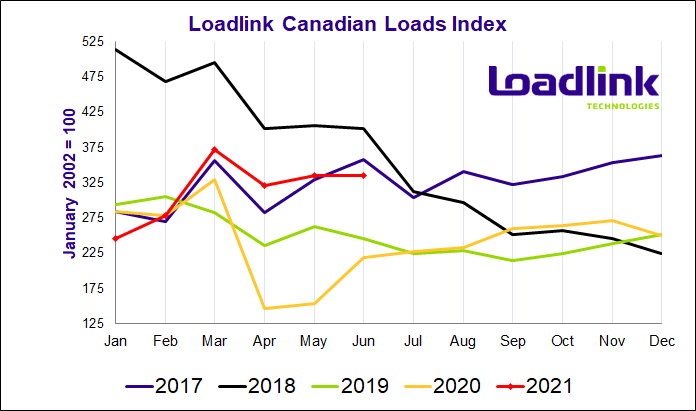
Table 3: Most Improved Inbound Domestic Lanes in June 2021
| Market Lane | Rank | Monthly Load Volume Change |
|---|---|---|
| Saskatchewan – Saskatchewan | 1 | +38% |
| Saskatchewan – Alberta | 2 | +34% |
| Saskatchewan – Ontario | 3 | +32% |
| Quebec – Newfoundland | 4 | +24% |
| Manitoba – Alberta | 5 | +23% |
*Based on lanes with at least 500 postings in June. Rankings are based on lanes with the largest percentage gains from May posting numbers (with minimum 500 postings).
Average Truck-to-Load Ratios
In June, the truck-to-load ratio increased by nine percent, reaching a value of 2.68 compared to 2.47 in May. Year-over-year, June’s truck-to-load ratio was 30 percent lower compared to a ratio of 3.84 in June 2020.
About Loadlink Indexes
Rate Index data is based on the average spot rates paid by freight brokers and shippers to carriers in the specific lanes where loads are hauled. This data also shows real-time and historical available capacity, and total truck-to-load ratios.
Freight Index data provides insight on Canada’s economy at large, and is a primary resource for the trucking community. The Freight Index accurately measures trends in the truckload freight spot market as its components are comprised from roughly 6,200 Canadian carriers and freight brokers. This data includes all domestic, cross-border, and interstate data submitted by Loadlink customers.
About Loadlink Technologies
Loadlink Technologies helps Canadian transportation companies facilitate the critical movement of goods by trucks through the use of its technology. With decades of propelling innovation and by way of its modernized freight matching, the company helps its members drive better business performance and competitiveness while delivering new levels of customer experiences.
Follow us on Facebook, LinkedIn, and on Twitter.