
Inbound cross-border load volumes still on the rise despite provincial lockdown measures causing decline in freight activity within Canada.
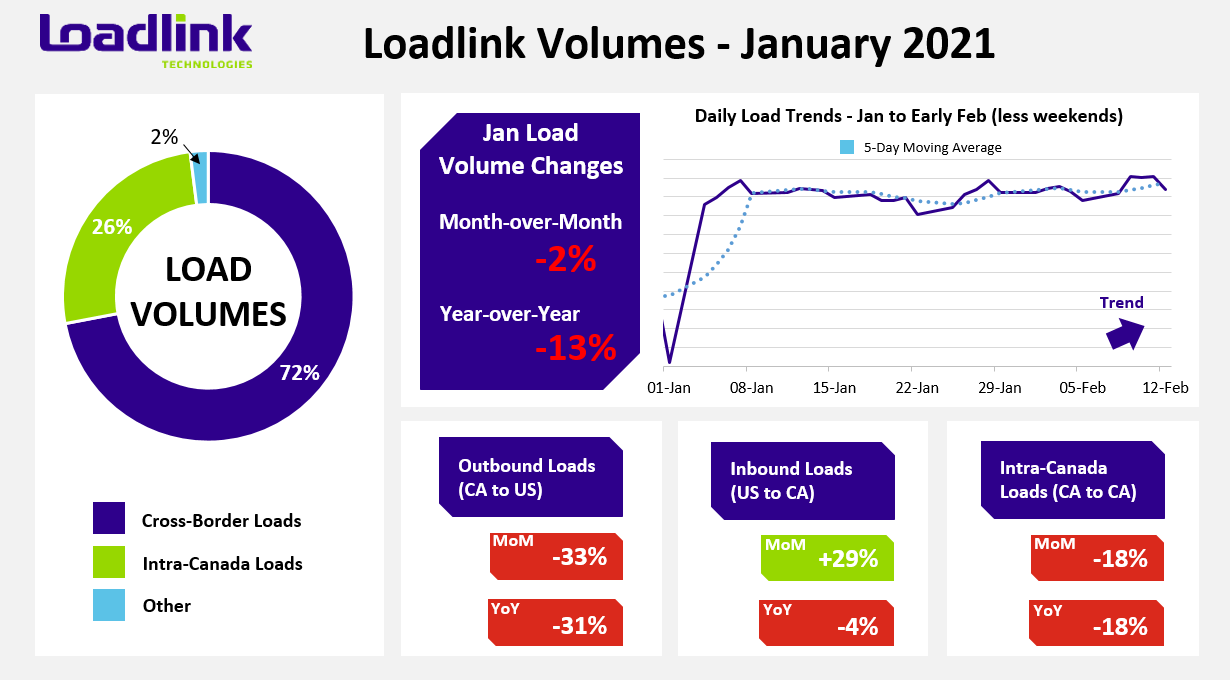
TORONTO – Canada’s truckload spot market started the new year with relatively little change from how 2020 ended. January saw two percent less loads compared to December 2020 which may have been a result of additional COVID-19 lockdown measures across Canadian provinces in December and into 2021. Due to these provincial lockdowns, intra-Canadian freight volumes saw a noticeable decline again as cross-border freight comprised almost three-quarters of all load posting activity on Loadlink’s spot market. Year-over-year, there were 13 percent less loads against January of 2020.
JANUARY HIGHLIGHTS
- January had slower activity than the last quarter of 2020, but with relatively consistent volumes throughout the entire month.
- Load volumes surged 145 percent in the first week of January following the drastic drop in freight that occurs during the Christmas holidays in the last week of the year.
- Weeks one, two and four of January saw average daily load posting numbers remain stable with less than a single percentage point variation between each week.
- The third week of January was the only outlier as average daily load postings fell five percent compared to the rest of the month.
As mentioned, continued lockdowns from the end of 2020 dampened freight volumes so far in 2021 for the short-term. Recent news of loosening restrictions across Quebec may help increase freight demand in February, while phased reopenings of certain regions within Ontario may also increase freight flow from within the province.
Outbound Cross-border Activity
For the fourth consecutive month, outbound cross-border load volumes saw both a month-over-month (-33%) and year-over-year (-31%) decline. Equipment postings rose 22 percent on a monthly basis, but fell seven percent on year-over-year comparisons to January 2020. Once again, outbound activity was muted across all regions of Canada, but Western Canada saw the smallest decline of 13 percent while the rest of Canada averaged 38 percent less loads destined to the United States.
British Columbia continued to show strong freight demand despite overall declines in outbound volumes as the province saw some lanes with substantial gains. In particular, four of the top five outbound cross-border provincial/state lanes involved British Columbia. The inbound markets of Oregon, California, Florida, and Utah all saw monthly gains of 41, 42, 66 and 76 percent more loads, respectively. The Alberta to Pennsylvania lane rounded out the top five with 71 percent more loads, which demonstrated Western Canada’s consistent freight environment.
Inbound Cross-border Activity
Continuing from December 2020’s trend of growing inbound cross-border freight volumes, January saw inbound loads grow 29 percent month-over-month and decline just four percent on a year-over-year basis. Equipment volumes were down six percent from December and fell four percent compared to January 2020. In December, Western Canada stood out with the only double digit gains, but in January, barring Atlantic Canada’s decrease in inbound cross-border freight, Western Canada was the only major region to see only a single digit increase. The Ontario and Quebec inbound markets both stepped up from December with impressive boosts in inbound freight volumes of 37 and 34 percent, respectively.
All states saw more freight entering Canada except for Connecticut, Nevada and Utah. The busiest markets that also saw some of the largest gains in comparison to other states included Texas (+28%), Ohio (+23%), Illinois (+63%), Pennsylvania (+49%) and Wisconsin (+43%). On a percentage increase basis, the two states that saw the largest relative monthly increase in freight to Canada were Mississippi (+81%) and Montana (+72%).
Intra-Canadian Activity
January saw intra-Canadian activities continue from where December left off as both inbound and outbound volumes across all regions saw further dips in activity. Unlike December, where the average decline spread between the major regions were all relatively similar to one another, January’s intra-Canadian declines varied more.
The province of Ontario saw 24 percent less outbound freight against 28 percent less inbound freight, which was the most heavily impacted region as a result of the continued provincial lockdown announced in December. Quebec load volumes were down 20 and 22 percent for total inbound and outbound volumes, respectively. Western Canada performed better than both Ontario and Quebec as declines in freight were limited to lesser amounts: a 14 percent decrease in outbound loads and a 10 percent drop with respect to inbound loads.
Among the popular domestic lanes with sufficient posting data, Western Canada once again shone with the only lanes that saw positive growth in January. On a total volume basis, Alberta to Manitoba performed the best out of all domestic provincial lanes with a month-over-month increase of 26 percent. The British Columbia outbound market to Alberta and Manitoba both saw decent gains of 12 and 51 percent more loads, respectively, but each lane had about a third of the total freight activity as Alberta to Manitoba.
Lane Increases
In January, inbound cross-border lanes topped the list of best performing lanes on Loadlink’s spot market for another month.
- In particular, the Ontario inbound market stood out as nine out of the top 10 best performing lanes that involved Ontario as the destination market.
- The Illinois outbound market to Ontario was the second busiest lane on Loadlink in January and was the lane with the largest increase in loads.
- The Illinois to Quebec lane snuck in at tenth position with a sizeable jump of 67 percent more loads from December, just barely beating out the Virginia to Ontario lane, which was up 42 percent month-over-month.
Table 1: Top 5 Lanes with Largest Absolute Increase in Loads
| Market Lane | Rank | Monthly Load Volume Change |
|---|---|---|
| Illinois – Ontario | 1 | +60% |
| Indiana – Ontario | 2 | +60% |
| Pennsylvania – Ontario | 3 | +39% |
| Wisconsin – Ontario | 4 | +42% |
| Ohio – Ontario | 5 | +27% |
*Based on lanes with at least 500 postings in January. Ranking is based on how many more loads that lane gained month-over-month, compared to all lanes visible on Loadlink (with minimum 500 postings).
Table 2: Top 5 Lanes with Largest Percentage Increase in Loads
| Market Lane | Rank | Monthly Load Volume Change |
|---|---|---|
| Mississippi – Ontario | 1 | +97% |
| Tennessee – Quebec | 2 | +92% |
| Virginia – Quebec | 3 | +87% |
| Nebraska – Ontario | 4 | +77% |
| Missouri – Ontario | 5 | +75% |
*Based on lanes with at least 500 postings in January. Ranking is based on how large the percentage increase in loads for that lane was compared to all lanes visible on Loadlink (with minimum 500 postings).
Figure 1: Top 10 Lanes in January by Largest % Increase in Average Loads per Poster

The following city-to-city lanes saw notable improvements in freight volumes on a monthly basis. Compared to the large decline witnessed in December that saw more than half of the top 100 city-to-city lanes decline in freight activity from November, two-thirds of the lanes in January saw positive growth on a monthly basis. As a result, a total of 67 lanes saw increased month-over-month comparisons, while exactly half of the lanes saw positive year-over-year changes.
Table 3: Spotlight City-to-City Lanes with Notable Improvements
| City-to-City Lane | Month-Over-Month Increase | Year-Over-Year Increase |
|---|---|---|
| Edmonton (AB) – Regina (SK) | +140% | +133% |
| Memphis (TN) – Mississauga (ON) | +120% | +143% |
| Prince George (BC) – Calgary (AB) | +109% | +220% |
| Edmonton (AB) – Winnipeg (MB) | +61% | +58% |
| Philadelphia (PA) – Toronto (ON) | +44% | +52% |
Average Truck-to-Load Ratios
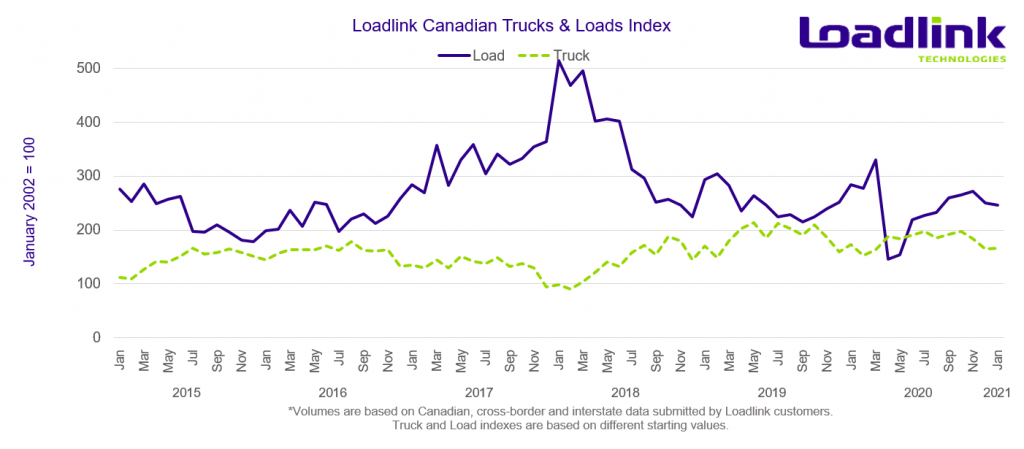
In January, capacity expanded by eight percent, reaching a value of 2.97 compared to 2.75 in December. Year-over-year, January’s truck-to-load ratio was 11 percent higher compared to a ratio of 2.68 in January 2020.
About Loadlink Indexes
Rate Index data is based on the average spot rates paid by freight brokers and shippers to carriers in the specific lanes where loads are hauled. This data also shows real-time and historical available capacity, and total truck-to-load ratios.
Freight Index data provides insight on Canada’s economy at large, and is a primary resource for the trucking community. The Freight Index accurately measures trends in the truckload freight spot market as its components are comprised from roughly 6,200 Canadian carriers and freight brokers. This data includes all domestic, cross-border, and interstate data submitted by Loadlink customers.
About Loadlink Technologies
Loadlink Technologies helps Canadian transportation companies facilitate the critical movement of goods by trucks through the use of its technology. With decades of propelling innovation and by way of its modernized freight matching, the company helps its members drive better business performance and competitiveness while delivering new levels of customer experiences.
Follow us on Facebook, LinkedIn, and on Twitter.