

Loadlink weathers the storm that is 2020 as overall annual load volumes down only four percent while truck-to-load balance tips toward slightly healthier levels in December.
TORONTO – In December, Loadlink’s Canadian spot market loads declined eight percent from November and decreased one percent compared to December 2019. Historically, December load volumes follow no clear trend, but extended lockdown measures enacted in December to combat rising COVID-19 cases may have played a role in diminished volumes. As expected, truck availability lessened due to more drivers wanting to be home during the holidays, which brought more balance to the spot market as the truck-to-load ratio dipped by three percent.
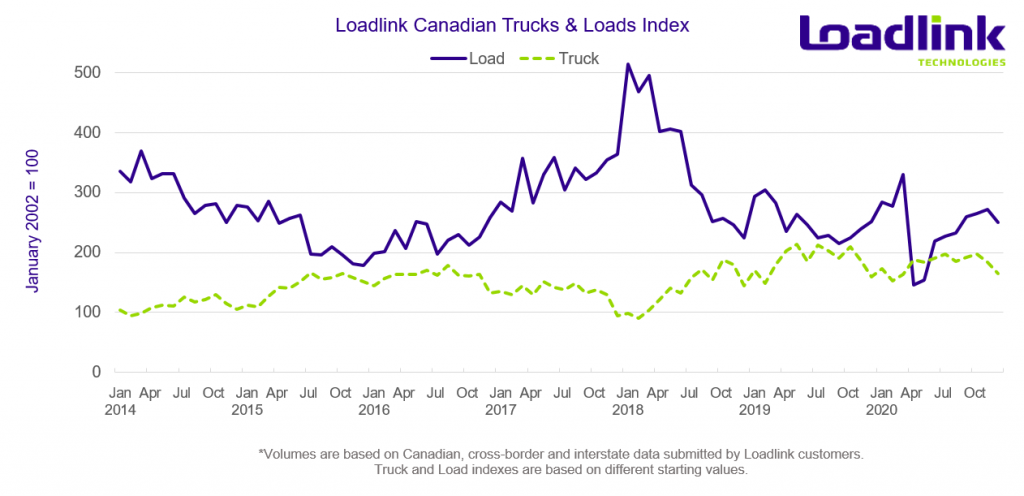
2020 SPOT FREIGHT HIGHLIGHTS
- March had the highest single month freight volumes since June 2018
- The onset of the COVID-19 pandemic eliminated over 50 percent of freight in April and May
- Recovery began in June following a 42 percent increase in freight volumes from May
- From April to November, monthly load volumes increased for seven consecutive months
- Annual truck and load volumes both fell four percent compared to 2019 resulting in only a one percent year-over-year decline in average truck-to-load ratio
DECEMBER HIGHLIGHTS
December freight volumes started off strong following November’s great performance leading up to the American Thanksgiving holiday. The first week of December saw load volumes jump 10 percent from the last week of November, primarily due to lessened volumes from the holidays which eliminated much cross-border freight. December continued to trend upwards with the second and third weeks of the month seeing consecutive week-over-week increases of four and five percent, respectively. During the third week of December, Loadlink’s spot market witnessed the latest single day high in freight since prior to the pandemic. Following some of the strongest weekly freight levels since March, both truck and load volumes dipped significantly due to the Christmas and New Year holidays, with back-to-normal volumes not seen until the first week of January.
Outbound Cross-border Activity
For the third consecutive month, outbound cross-border load volumes saw both a month-over-month (-13%) and year-over-year (-24%) decline. Equipment postings fell 14 percent on a monthly basis, which was generally in line with other major Canadian regions, while on a year-over-year comparison was down just three percent. Activity was generally muted across all regions of Canada with Quebec delivering 23 percent less freight while Ontario and Western Canada were the sources of nine and eight percent less freight, respectively.
Although outbound cross-border loads continued a streak of negative performances, some standout provincial/state lanes include Manitoba to Wisconsin, Alberta to Washington and British Columbia to Washington. The lanes above saw freight volume increases of 83, 62 and 48 percent, respectively.
Inbound Cross-border Activity
In contrast to recent months of slowing outbound cross-border activity, inbound activity on the Canadian spot market continued to improve on both a monthly and year-over-year basis despite the holiday season and overall lessened activity in the latter half of December. Month-over-month, inbound load postings increased three percent while year-over-year, December 2020 saw 23 percent more loads compared to 2019. Truck availability decreased 15 percent from November and was short seven percent compared to 2019.
Western Canada had the largest month-over-month growth with a 10 percent boost in volumes. Ontario saw just a slight uptick of two percent more loads, while inbound load volumes to Quebec remained virtually unchanged. Most major American states with a heavy supply of loads inbound to Canada saw between three to five percent more loads. Other states with moderate amounts of loads with the largest gains in monthly load postings included Louisiana (+36%), Massachusetts (+27%) and Connecticut (26%).
Intra-Canadian Activity
Loadlink’s trend of growing domestic activity was halted by a slower holiday season, but the overall impact was dulled due to a balanced decline in truck availability. Intra-Canadian activity saw a 15 percent decrease in both load and truck postings in December compared to the previous month. Year-over-year, the freight decline was lesser at just three percent, while truck volumes rose five percent compared to December 2019.
Declines in freight from all domestic origin and destination pairings within Canada was visible across the board with almost all provinces hovering around the average mark of 15 percent less freight with no apparent outliers. This is a good indicator of a quiet winter holiday period being the primary cause for lessened domestic spot market activity as the decline was equally shared among all regions, rather than any substantial market movement due to shifts in any provinces’ economic or coronavirus-related responses. Among all domestic lanes, only a handful saw positive gains in activity from November. This included Saskatchewan to Manitoba (+19%), Quebec to New Brunswick (+16%), Ontario to Quebec (+6%), Ontario to New Brunswick (+3%) and Manitoba to Alberta (+2%).
Lane Increases
In December, the best performing lanes belonged to cross-border inbound markets. As noted in previous sections, both outbound cross-border and domestic lanes saw overall declines, which left inbound lanes the opportunity to occupy the top ranks in regards to absolute month-over-month increases in load volumes and in relative percentage gains. The Alberta to Washington lane appeared in both tables as a standout lane, being the only non-inbound lane that saw both large total volume and percentage increases in load postings in December.
Table 1: Top 5 Lanes with Largest Absolute Increase in Loads
| Market Lane | Rank | Monthly Load Volume Change |
|---|---|---|
| Pennsylvania – Ontario | 1 | +28% |
| Ohio – Ontario | 2 | +16% |
| Texas – Ontario | 3 | +14% |
| Alberta – Washington | 4 | +62% |
| New Jersey – Ontario | 5 | +21% |
*Based on lanes with at least 500 postings in December. Ranking is based on how many more loads that lane gained month-over-month, compared to all lanes visible on Loadlink (with minimum 500 postings).
Table 2: Top 5 Lanes with Largest Percentage Increase in Loads
| Market Lane | Rank | Monthly Load Volume Change |
|---|---|---|
| Ohio – Alberta | 1 | +86% |
| Manitoba – Wisconsin | 2 | +83% |
| Alberta – Washington | 3 | +62% |
| Massachusetts – Ontario | 4 | +58% |
| Colorado – Ontario | 5 | +49% |
*Based on lanes with at least 500 postings in December. Ranking is based on how large the percentage increase in loads for that lane was compared to all lanes visible on Loadlink (with minimum 500 postings).
Figure 1: Top 10 Lanes in December by Largest % Increase in Average Loads per Poster

The following city-to-city lanes saw notable improvements in freight volumes on a monthly basis. The overall decline in freight activity from the winter holiday season contributed to more than half of the top 100 lanes that saw growth in November seeing percentage decreases in December instead. As a result, a total of 41 lanes saw increased month-over-month comparisons while 65 lanes saw positive year-over-year changes.
Table 3: Spotlight City-to-City Lanes with Notable Improvements
| City-to-City Lane | Month-Over-Month Increase | Year-Over-Year Increase |
|---|---|---|
| Fort McMurray (AB) – Edmonton (AB) | +61% | +42% |
| Mississauga (ON) – Delta (BC) | +42% | -44% |
| Chicago (IL) – Toronto (ON) | +38% | 44% |
| Memphis (TN) – Toronto (ON) | +38% | +70% |
| Bridgeton (NJ) – Mississauga (ON) | +32% | +70% |
Average Truck-to-Load Ratios
In December, capacity tightened by three percent reaching a value of 2.89 compared to 2.98 in November. This marked the lowest truck-to-load ratio since March, prior to the onset of the pandemic in Canada. Year-over-year, December’s truck-to-load ratio was four percent higher compared to a ratio of 2.78 in December 2019.

2020 Review and What’s in Store for 2021?
Many across the trucking industry thought that freight demand may have hit a temporary floor in 2019 and was poised for a breakout in 2020, but the COVID-19 pandemic reset expectations. The first quarter of 2020 very closely resembled that of 2017 where Loadlink’s spot market first began noticing a surge in load postings on the Canadian spot market that ended in mid-2018 after truck availability tumbled following ELD mandates in the United States. Unfortunately, COVID-19 outbreaks across North America prevented 2020 spot freight volumes from growing even more; instead, mirrored very low volumes that have not been seen since the economic downturn following 2008.
The resilience and essential nature of freight logistics ensured that demand would pick up as the third quarter of 2020 saw load postings on the spot market return to numbers resembling the 2019 norm. This past Q4 improved upon this even more as quarterly load totals beat out every other quarter since 2019 barring Q1 of each year. Truck availability remained relatively stable throughout the course of the pandemic, signaling the second best year in terms of total annual truck postings, behind 2019 values.
Early 2021 load volumes have returned to ‘normal’ compared to the slow activity on the spot market that is seen during the winter holidays, but not yet at the impressive levels noted in the first half of December 2020. Provincial lockdown measures in Canada introduced in December may have played a role in negatively affecting freight demand for the short term and caused accelerated freight mid-December to ensure supply chain demands were met prior to lockdown restrictions being put into place. Recent historical trends have shown that the spot market typically improves in the first quarter of the year and with a growing supply of vaccinations that will be available in the coming months, 2021 may follow suit. Hot freight activity in the US market has trickled over to the Canadian spot market as inbound cross-border activity has been heated and growing steadily the past few months. With Canadian ELD mandates set to take place mid-year, 2021 will have a lot to improve upon from 2020 as truck availability may take a hit while loads recover further into the year.
Overall, in spite of 2020’s major headlines and negativity associated with the novel coronavirus, the trucking industry stepped up and ensured that relief and essential goods were available to consumers. As a result, overall load and truck volumes only endured minor declines from the previous year while highlighting the potential for growth in 2021. During these difficult times, thanks to the tireless work of truckers and all other essential workers, the Canadian trucking industry remains strong and has set itself up to further grow and expand.
About Loadlink Indexes
Rate Index data is based on the average spot rates paid by freight brokers and shippers to carriers in the specific lanes where loads are hauled. This data also shows real-time and historical available capacity, and total truck-to-load ratios.
Freight Index data provides insight on Canada’s economy at large, and is a primary resource for the trucking community. The Freight Index accurately measures trends in the truckload freight spot market as its components are comprised from roughly 6,200 Canadian carriers and freight brokers. This data includes all domestic, cross-border, and interstate data submitted by Loadlink customers.
About Loadlink Technologies
Loadlink Technologies helps Canadian transportation companies facilitate the critical movement of goods by trucks through the use of its technology. With decades of propelling innovation and by way of its modernized freight matching, the company helps its members drive better business performance and competitiveness while delivering new levels of customer experiences.
Follow us on Facebook, LinkedIn, and on Twitter.