November mimicked October’s performance as once again, Western Canada and inbound cross-border freight activity leads the charge in sustaining Loadlink’s growing spot market.
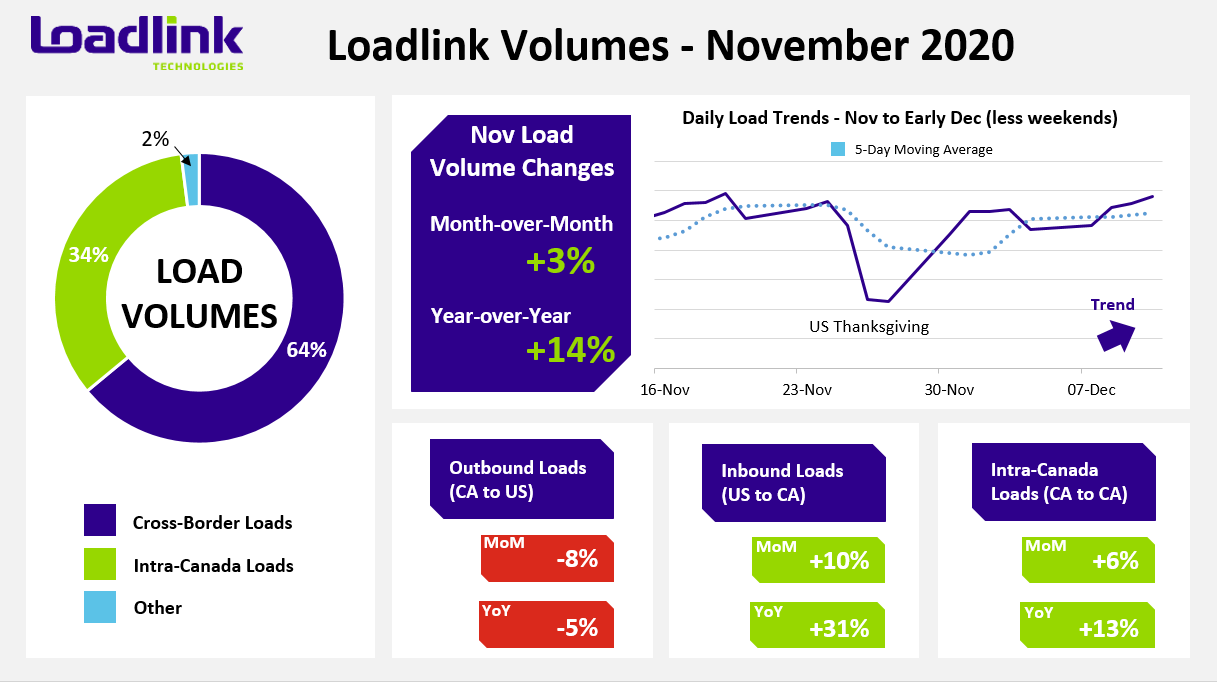
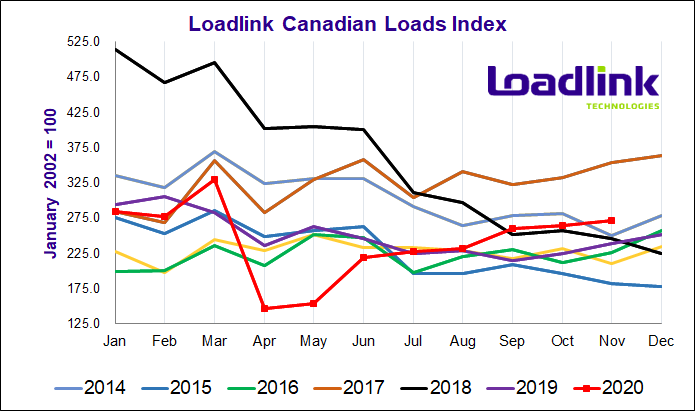
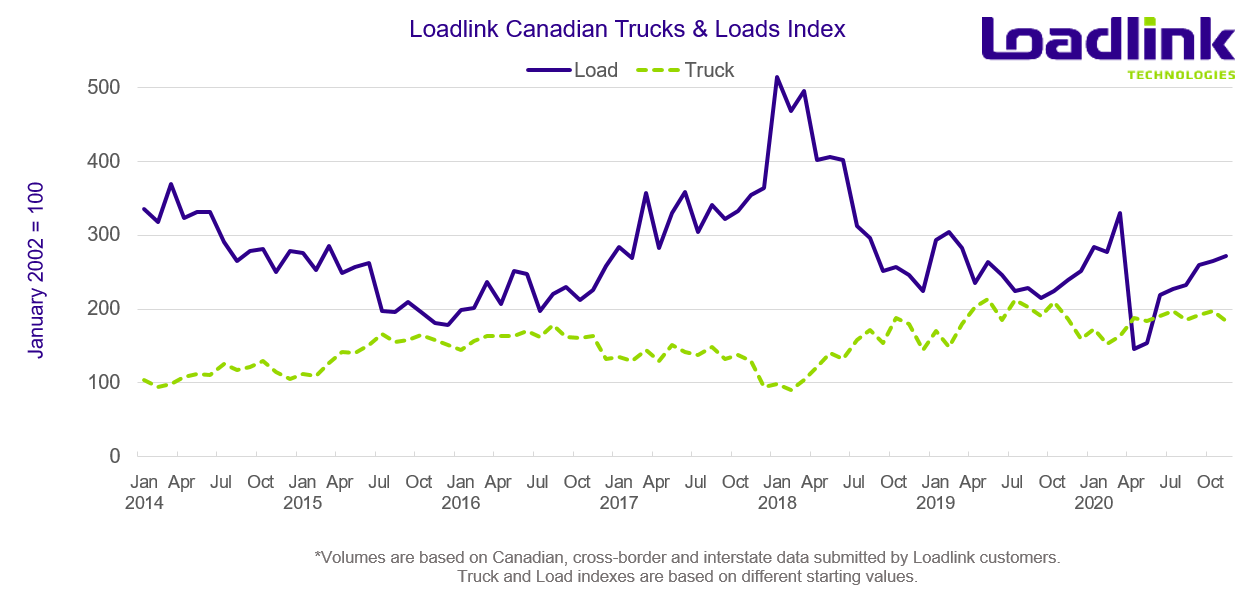
TORONTO – Loadlink’s Canadian spot market saw average daily and overall monthly load totals rise three percent compared to October. November’s improved load tally marked the seventh consecutive month of positive growth, continuing Loadlink’s longest streak since tracking this data. Truck availability diminished slightly by seven percent due to the American Thanksgiving long weekend available capacity. On an annual basis, November’s 2020 load volumes surpassed November 2019 by a respectable 14 percent, while equipment postings remained relatively flat with just a single percentage point decline.
Similar to last month, Western Canada’s standout performance in freight volumes continued to propel domestic activity. Growing inbound cross-border freight activity also helped alleviate the burdens of the coronavirus on two of Canada’s largest markets as outbound activity lagged behind with monthly declines from October.
NOVEMBER HIGHLIGHTS
November began the month with a smooth transition in load volumes from the last week of October as load volumes remained flat. Load volumes took a dip in week two due to Remembrance Day (Nov. 11) which removed 11 percent of daily loads on that day compared to the weekly average. The third week of November saw the best weekly performance on Loadlink since the onset of the pandemic as average daily load volumes for the week rose 13 percent compared to the week before. The final week of the month saw a larger change due to the American Thanksgiving holiday which resulted in 13 percent less freight overall compared to week three’s standout volumes.
Although the last quarter of the year is laden with several holidays across North America, growing load volumes show the resilience of the overall freight industry despite shutdowns amidst a new wave of coronavirus cases. December load volumes have historically followed no clear trend and can fall on either end of the spectrum in regards to higher or lower number of loads compared to November. But with a larger shift to online shopping during the pandemic and less in-person gift hauls from large retailers and big box stores, the Canadian spot market may see an uptick in activity, year-over-year, to accommodate increased demand to fulfill this need. Loadlink Technologies expects load volumes to rise slightly in December while equipment availability will take a slight dip.
Outbound Cross-border Activity
Outbound freight activity between Canada and the United States continued the trend seen in October with another monthly decline (-8%) alongside an annual decrease (-5%) compared to November 2019. Truck availability entering the US was down by a lesser degree, with a month-over-month decline of four percent against a three percent year-over-year drop. All Canadian regions delivered less freight to the US from the Canadian spot market with Western Canada leading the decrease at 14 percent, followed by Ontario with a seven percent drop. Quebec and Atlantic Canada outbound loads fell at just slightly lower levels of four and three percent, respectively.
The largest markets that saw the biggest declines in inbound freight included New Hampshire, Arizona, Idaho, North Dakota and Kansas, with an average of 35 percent less cross-border loads destined to each state. Despite the overall decline, the North Carolina and Alabama markets saw some strong improvements with 21 and 23 percent more inbound loads, respectively.

Inbound Cross-border Activity
Inbound cross-border freight destined to Canada had a strong showing in November with 10 percent more loads compared to October and 31 percent more loads when measured against November 2019. In contrast, equipment postings fell by 11 percent month-over-month and six percent year-over-year. All the major Canadian regions minus Atlantic Canada saw boosted inbound freight volumes as Western Canada paved the way with 22 percent more loads. Ontario and Quebec both saw smaller but positive gains of nine and six percent more loads respectively, while Atlantic Canada experienced an 11 percent decrease in load postings.
The busier markets in the US that saw the largest improvements in outbound freight to Canada included Maryland, Florida, and Arizona for the second consecutive month. Across these three states, each saw an average of 40 percent more loads heading into Canada. Generally, the three busiest cross-border markets are California, Texas and Ohio. Of the three, Ohio was the only state that saw a decline in freight volumes (-7%) while California posted strong improvements of 28 percent more outbound loads against a respectable 10 percent increase from Texas.
Intra-Canadian Activity
Loadlink’s domestic activity once again saw positive growth with a six percent increase in monthly load volumes while year-over-year comparisons were stronger in November by 13 percent compared to 2019. Just like in October, of the regions, Western Canada saw the strongest uplift in November with an overall increase of 24 percent more domestic loads.
As Ontario and Quebec continue to recover from recent waves of rising COVID-19 cases, both markets saw six and nine percent less overall loads, respectively. In contrast to October, Ontario saw a small increase in loads destined to the region (+2%), but was primarily held back by a dip in loads originating from the province (-13%). In November, Quebec saw a four percent dip in loads from the province but the gain in loads from the previous month was eliminated by a 13 percent decline. Atlantic Canada experienced similar results as October with another month of four percent less overall loads to and from the region.


Lane Increases
Western Canada’s strong performance for the second month in a row is clearly evident in the tables below, primarily in terms of intra-Canadian and inbound cross-border activity. While domestic lanes with their busier nature on the Canadian spot market dominated the overall largest freight volume increase, inbound cross-border lanes occupied all the top spots for lanes with the largest percentage increases in load volumes. Weaker outbound cross-border performance ensured no qualifying lanes appeared in any of the top five lists of positive absolute load volume or percentage changes compared to October. The best performing outbound cross-border lane was Quebec to South Carolina which saw 57 percent more loads, barely missing the top five list by placing in the seventh position.
Table 1: Top 5 Lanes with Largest Absolute Increase in Loads
| Market Lane | Rank | Monthly Load Volume Change |
|---|---|---|
| Alberta – British Columbia | 1 | +55% |
| Ontario – Alberta | 2 | +44% |
| Ontario – British Columbia | 3 | +56% |
| California – Ontario | 4 | +22% |
| Alberta – Manitoba | 5 | +84% |
*Based on lanes with at least 500 postings in November. Ranking is based on how many more loads that lane gained month over month, compared to all lanes visible on Loadlink (with minimum 500 postings).
Table 2: Top 5 Lanes with Largest Percentage Increase in Loads
| CIty-to-City Lane | Month-Over-Month Increase | Year-Over-Year Increase |
|---|---|---|
| Douglas (GA) – Montreal (QC) | 248% | 551% |
| Mississauga (ON) – Delta (BC) | 224% | 145% |
| Calgary (AB) – Richmond (BC) | 195% | 254% |
| Vilna (AB) – Gilroy (CA) | 140% | 970% |
| Mississauga (ON) – Winnipeg (MB) | 91% | 43% |
*Based on lanes with at least 500 postings in November. Ranking is based on how many more loads that lane gained month over month, compared to all lanes visible on Loadlink (with minimum 500 postings).
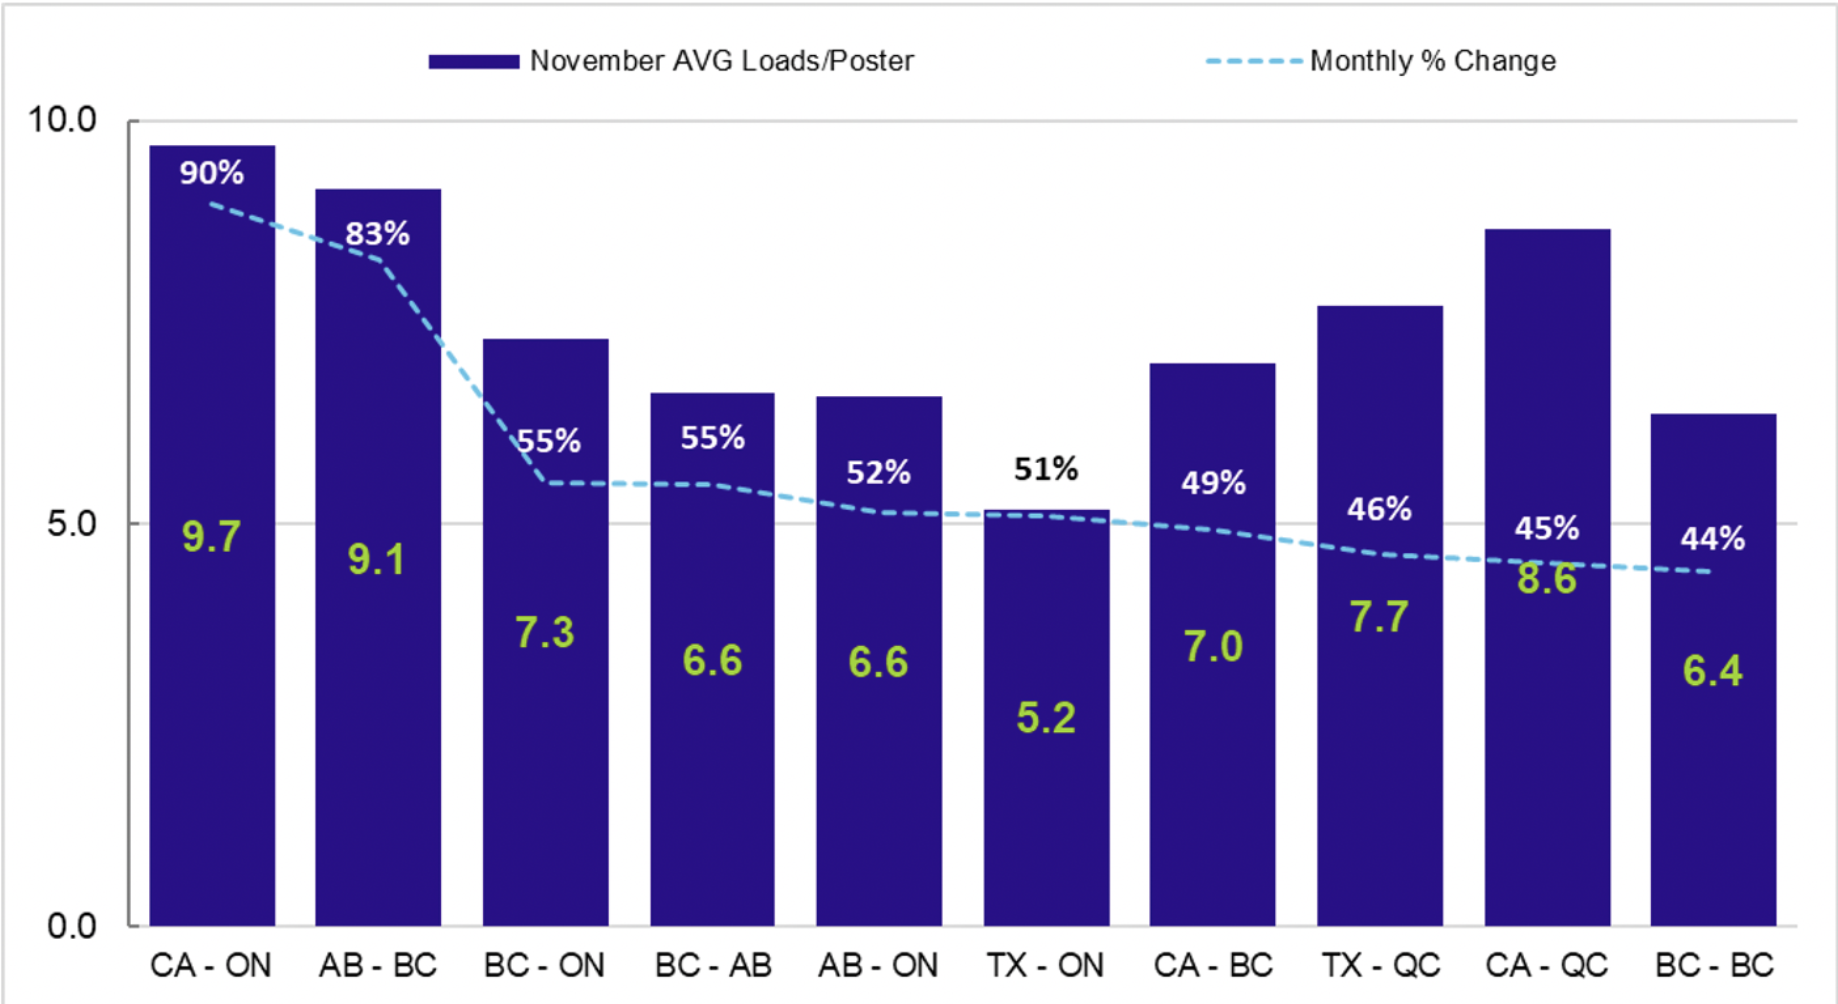
Figure 1: Top 10 Lanes in November by Large % Increase in Average Loads per Poster

The following city-to-city lanes saw notable improvements in freight volumes on a monthly basis. The top 100 lanes continue to improve as 10 more lanes saw monthly gains, while there was no change in the number of lanes that saw positive year-over-year comparisons. As a result, a total of 85 lanes saw increased month-over-month comparisons, while 85 lanes also saw positive year-over-year changes. Of the lanes that saw load volume declines from October, all city lanes within the top 100 busiest lanes involving the Toronto to Montreal corridor saw declines—primarily due to lockdown measures in response to resurgences of COVID-19 cases in the two metropolitan markets.
Table 3: Spotlight City-to-City Lanes with Notable Improvements
| Market Lane | Rank | Monthly Load Volume Change |
|---|---|---|
| California – Alberta | 1 | +84% |
| Delaware – Ontario | 2 | +80% |
| Georgia – Quebec | 3 | +75% |
| Texas – British Columbia | 4 | +70% |
| Idaho – Ontario | 5 | +70% |
Average Truck-to-Load Ratios
In November, capacity tightened by the largest amount (-9%) since June 2020, reaching a value of 2.98 compared to 3.28 in October. This is the first time the truck-to-load ratio has fallen to a value below 3.00 since March 2020, trending in the right direction prior to the onset of the novel coronavirus pandemic in North America. Year-to-date, truck postings on Loadlink’s spot market peaked in October and fell in November to the lowest point since March, which aided in contracting the capacity ratio to healthier levels. Year-over-year, November’s truck-to-load ratio was 13 percent lower compared to a ratio of 3.43 in November 2019.
About Loadlink Indexes
Rate Index data is based on the average spot rates paid by freight brokers and shippers to carriers in the specific lanes where loads are hauled. This data also shows real-time and historical available capacity, and total truck-to-load ratios.
Freight Index data provides insight on Canada’s economy at large, and is a primary resource for the trucking community. The Freight Index accurately measures trends in the truckload freight spot market as its components are comprised from roughly 6,200 Canadian carriers and freight brokers. This data includes all domestic, cross-border, and interstate data submitted by Loadlink customers.
About Loadlink Technologies
Loadlink Technologies helps Canadian transportation companies facilitate the critical movement of goods by trucks through the use of its technology. With decades of propelling innovation and by way of its modernized freight matching, the company helps its members drive better business performance and competitiveness while delivering new levels of customer experiences.
Follow us on Facebook, LinkedIn, and on Twitter.
