
Strong inbound cross-border freight supply and standout volumes from Western Canada to thank for growth volumes.
TORONTO – Loadlink’s Canadian spot market saw overall load volumes increase two percent month-over-month, while freight demand surpassed October 2019 with a sizeable increase of 18 percent more load postings.
Freight volumes in October closed in on similarly strong numbers seen in the first quarter of 2020 prior to the novel coronavirus pandemic. A small, but gradual, improved average number of daily postings contributed to the positive monthly growth witnessed throughout each month since April.
As seen in some earlier months this year, a strong push in the last week of the month helped propel volumes into a positive territory to continue the trend of four consecutive months of positive year-over-year comparisons, and marking six consecutive months of increasing load volumes.
OCTOBER HIGHLIGHTS
The month started off with decent volumes as the end of Q3 in September boosted freight volumes, causing a higher supply of freight to linger into the remainder of the week. Average daily load volumes then proceeded to dip six percent, entering the following week, which was attributed to the Canadian Thanksgiving holiday. The remainder of October saw back and forth changes on a week-over-week basis as freight volumes would rise in week 2 (+5%), followed by another decline in week 3 (-2%), and ended with another strong finish to the month (+3%).
The coronavirus pandemic saw new surges in cases across Canada with Ontario and Quebec being the predominant provinces affected at the start of the month. In the latter portion of October, rising cases in the Western regions of Canada also made headlines in the news. As a result of Ontario and Quebec’s reignited efforts to stem further outbreaks, increased safety measures (including a lockdown in Quebec) and impacted economies altered the usual freight flow entering and leaving those regions.
Although the overall spot market improved, Loadlink’s busiest corridor between Ontario and Quebec saw an average of 15 percent less freight regardless of inbound or outbound status. Intra-provincial freight within Ontario and Quebec also fell three and nine percent, respectively.
Outbound Cross-border Activity
Outbound freight activity between Canada and the United States fell seven percentage points, and counteracted much of the overall cross-border improvement seen from inbound activity. Equipment travelling to the US remained flat with virtually no change. Ontario and Western Canada had an average of 15 percent less loads destined to the US, while both Quebec and Atlantic Canada actually saw 13 percent more loads entering the US. Year-over-year, outbound cross-border loads increased three percent while truck availability declined by 10 percent.
The largest markets that saw the biggest declines in inbound freight included Pennsylvania, Utah and Idaho, ranging between 16 to 19 percent less loads to each state. Despite the overall decline, Colorado, Oregon, and Washington saw improvements with an average of 21 percent more loads destined to these states.
Inbound Cross-border Activity
Inbound freight destined to Canada saw an overall eight percent increase against five percent more trucks available. Western Canada saw the largest gain of 15 percent, while Quebec and Ontario followed suit with eight and six percent gains respectively. Atlantic Canada saw a marginal single percentage point gain in inbound cross-border freight from September. Year-over-year, inbound cross-border freight saw a large 35 percent increase against 10 percent less trucks.
The busier markets in the US that saw the largest improvements in outbound freight to Canada included Arizona, California and Texas. Arizona led all states with the largest percentage gains of 134 percent. California performed impressively with 62 percent more loads and Texas had a strong increase of 23 percent more cross-border freight.
Intra-Canadian Activity
Domestic activity on Loadlink’s spot market saw an overall positive improvement with five percent more loads and three percent more equipment. Year-over-year, domestic load postings were also up 14 percent. Western Canada was the standout region as 30 percent more loads originated from and 16 percent more loads were destined to the region. Market dynamics in Ontario and Quebec were more interesting as they saw contrasting results. Ontario witnessed a 13 percent increase in loads originating from the province, but had 12 percent less loads destined to it. On the other hand, the province of Quebec had 39 percent less outbound loads, while their inbound traffic increased 38 percent.
Lane Increases
As inbound cross-border activity showed a significant boost in activity, some of the busiest lanes that saw the largest increase in load postings on the Canadian spot market consisted of freight originating from US markets. Western Canada’s standout performance in both cross-border inbound freight as well as intra-Canadian activity propelled British Columbia and Alberta to occupy six out of the top 10 spots for overall load volume increases. Despite the overall decline in loads destined to Ontario, some of the busiest lanes included the inbound Ontario market.
Table 1: Lanes with the Largest Load Volume Increases Month-over-Month
| Market Lane | Rank | Monthly Load Volume Change |
|---|---|---|
| California – Ontario | 1 | +64% |
| Alberta – British Columbia | 2 | +27% |
| British Columbia – Ontario | 3 | +86% |
| British Columbia – Alberta | 4 | +64% |
| Alberta – Ontario | 5 | +50% |
| Texas – Ontario | 6 | +23% |
| California – British Columbia | 7 | +73% |
| Texas – Quebec | 8 | +62% |
| California – Quebec | 9 | +48% |
| British Columbia – British Columbia | 10 | +18% |
*Based on lanes with at least 500 postings in October. Ranking is based on how many more loads that lane gained month-over-month, compared to all lanes visible on Loadlink (with minimum 500 postings).
Figure 1: Top 10 Lanes in October by Average Loads per Poster with Monthly Percentage Change
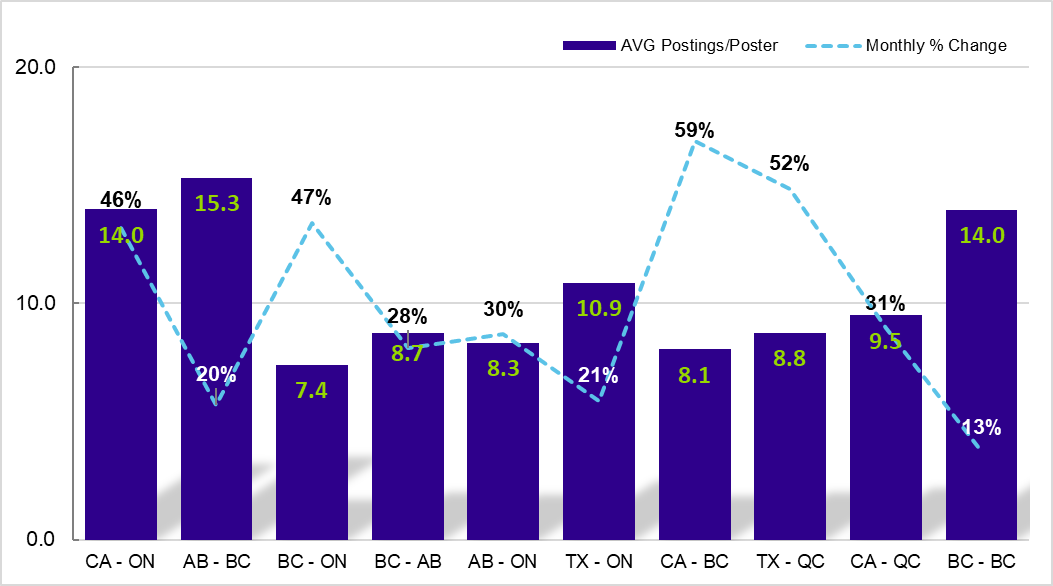
The following city-to-city lanes saw notable improvements in freight volumes on a monthly basis. For the third consecutive month, year-over-year comparisons continue to trend positively as more lanes saw improvements on an annual basis than on a monthly basis. The top 100 lanes continued to improve as 16 more lanes saw monthly gains while nine more lanes saw positive year-over-year comparisons. As a result, a total of 77 lanes saw increased month-over-month comparisons, while 85 lanes saw positive year-over-year changes.
Table 2: Spotlight City-to-City Lanes with Notable Improvements
| City-to-City Lane | Month-Over-Month Increase | Year-Over-Year Increase |
|---|---|---|
| Nogales (AZ) – Toronto (ON) | 476% | 207% |
| Vancouver (BC) – Toronto (ON) | 233% | 463% |
| Edmonton (AB) – Montreal (QC) | 179% | 382% |
| Los Angeles (CA) – Toronto (ON) | 175% | 335% |
| McAllen (TX) – Montreal (QC) | 109% | 146% |
| Delta (BC) – Edmonton (AB) | 96% | 277% |
| Calgary (AB) – Vancouver (BC) | 86% | 41% |
Average Truck-to-Load Ratios
In October, capacity loosened by a single percentage point to a ratio of 3.28 from a value of 3.24 in September. Although load volumes went up again on a monthly basis, October truck volumes hit an annual high as a result of a three percent increase in equipment volumes. Year-over-year, October’s truck-to-load ratio saw an improvement at 20 percent lower compared to a ratio of 4.11 in October 2019.
About Loadlink Indexes
Rate Index data is based on the average spot rates paid by freight brokers and shippers to carriers in the specific lanes where loads are hauled. This data also shows real-time and historical available capacity, and total truck-to-load ratios.
Freight Index data provides insight on Canada’s economy at large, and is a primary resource for the trucking community. The Freight Index accurately measures trends in the truckload freight spot market as its components are comprised from roughly 6,000 Canadian carriers and freight brokers. This data includes all domestic, cross-border, and interstate data submitted by Loadlink customers.
About Loadlink Technologies
Loadlink Technologies helps Canadian transportation companies facilitate the critical movement of goods by trucks through the use of its technology. With decades of propelling innovation and by way of its modernized freight matching, the company helps its members drive better business performance and competitiveness while delivering new levels of customer experiences.