
Loads, loads, and more loads for November as accelerated daily volumes are seen throughout the month.
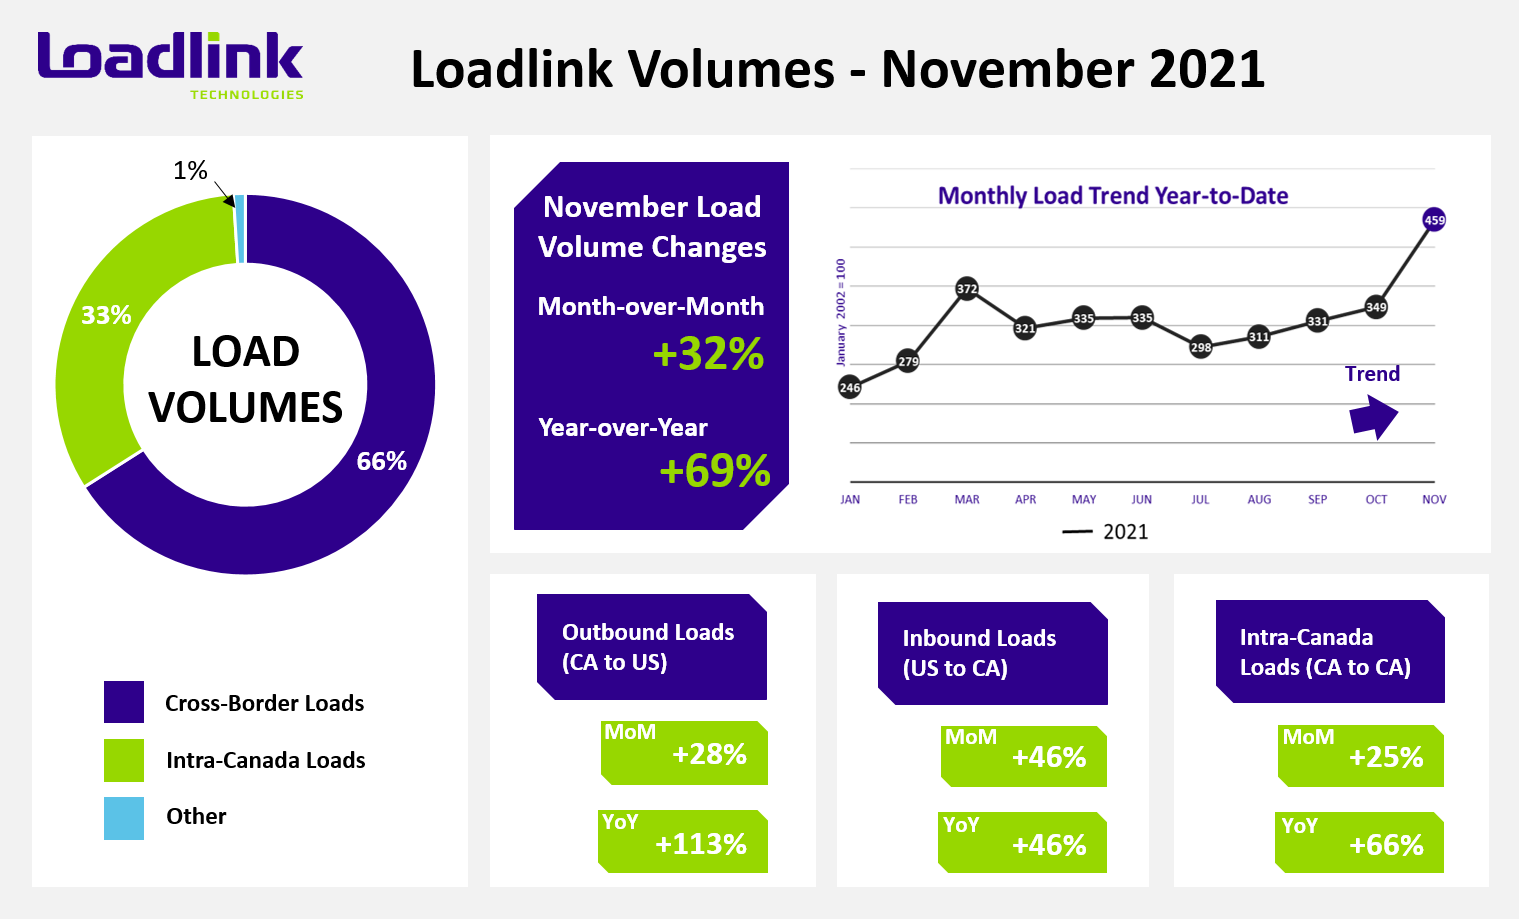
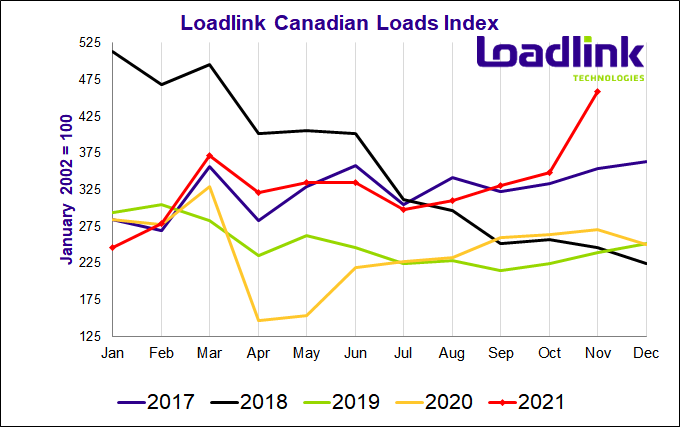
TORONTO – Loadlink Technologies’ Canadian spot market continued to buck historic trends that traditionally see lowering demand for capacity near the end of a calendar year. Compared to the same month last year, volumes saw a strong increase of 69 percent year-over-year. Compared to the previous month, November’s loads were up 32 percent month-over-month.
“These past few months have shown a clear sign that even through all of the uncertainty that the pandemic continues to cast, along with the bottlenecks within the supply chain, the spike in demand remains strong,” says Claudia Milicevic, president of Loadlink Technologies.
November’s Canadian spot market saw significant surges in the movement of freight within Canada and in and out of Canada.
Outbound Cross-border Activity
Month-over-month, loads from Canada to the United States were up 28 percent compared to October 2021, while year-over-year, there was a triple-digit increase of 113% of loads leaving Canada bound for the United States. Equipment postings were nine percent lower from October and showed no change compared to November 2020.
Inbound Cross-border Activity
There was a significant spike in loads coming into Canada where there was an equal percentage increase of 46 percent in load volumes compared to last month as well as compared to November of last year. Equipment postings were lower by three percent from October and up six percent year-over-year.
Intra-Canadian Activity
Freight activity within Canada was also very healthy. Month-over-month, loads within Canada heated up 25 percent, while year-over-year, this number spiked 66 percent higher than November 2020. Equipment postings were one percent higher than October and up five percent year-over-year.
Average Truck-to-Load Ratios
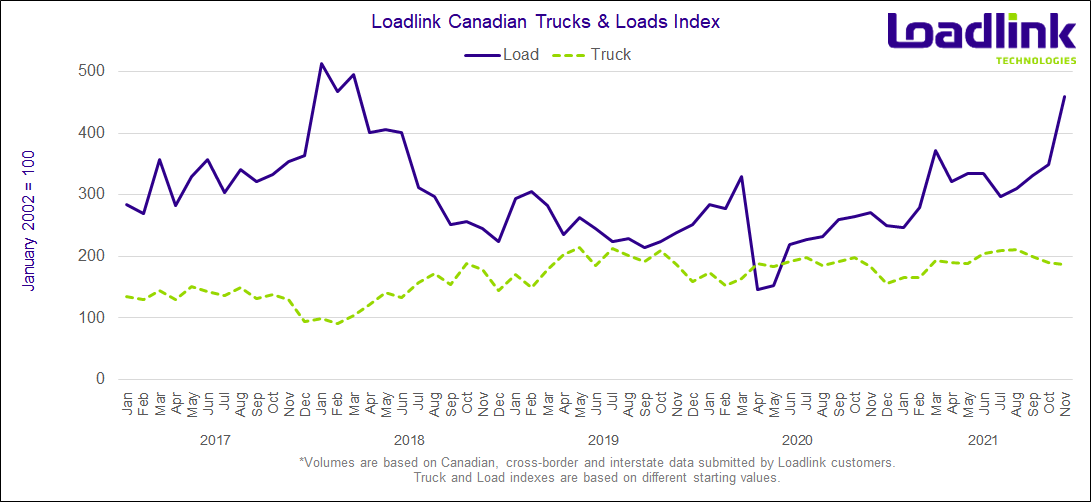
For the first time in years, the truck-to-load ratio dipped below two trucks for every one load posted on the system. The ratio for November was 1.79 available trucks for every load posted, down 25 percent from 2.39 in October. The last time capacity tightened to these levels was June of 2018 when the capacity was 1.45 trucks for every load posted. Year-over-year, November’s truck-to-load ratio was 40 percent lower compared to a ratio of 2.98 in November 2020.
About Loadlink Indexes
Rate Index data is based on the average spot rates paid by freight brokers and shippers to carriers in the specific lanes where loads are hauled. This data also shows real-time and historical available capacity, and total truck-to-load ratios.
Freight Index data provides insight on Canada’s economy at large, and is a primary resource for the trucking community. The Freight Index accurately measures trends in the truckload freight spot market as its components are comprised from roughly 6,200 Canadian carriers and freight brokers. This data includes all domestic, cross-border, and interstate data submitted by Loadlink customers.
About Loadlink Technologies
Loadlink Technologies helps Canadian transportation companies facilitate the critical movement of goods by trucks through the use of its technology. With decades of propelling innovation and by way of its modernized freight matching, the company helps its members drive better business performance and competitiveness while delivering new levels of customer experiences.