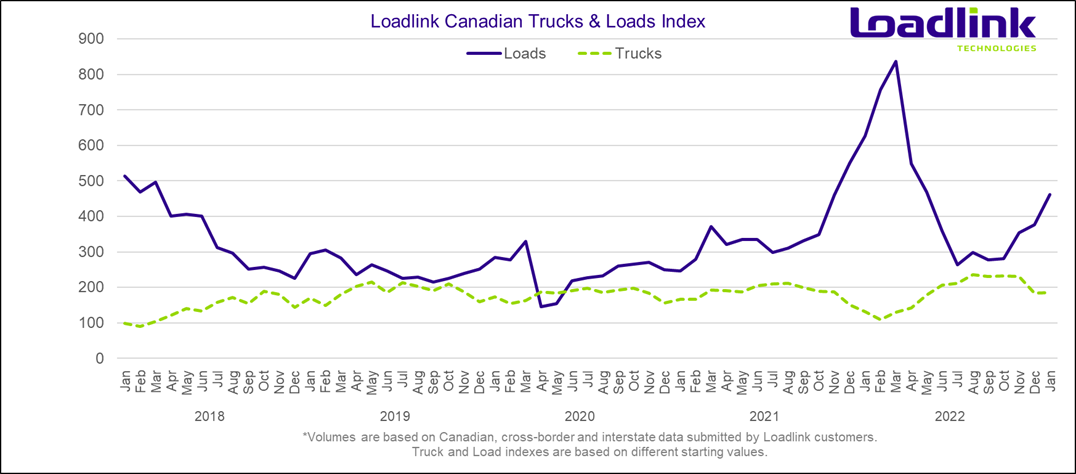
TORONTO – Loadlink Technologies’ Canadian spot market continued its momentum to start the new year with 22 percent more loads and seven percent more trucks, marking the fourth consecutive month of growth. Most of the growth can be attributed to a significant increase in inbound cross-border loads. Year-over-year comparisons to early 2022 are down (-26% from January 2022) as record Q1 performance last year may overshadow another standout January.
January SPOT FREIGHT HIGHLIGHTS
| Origin City | Origin State | Destination City | Destination State | Vehicle | YoY (%) | MoM (%) |
| Philadelphia | PA | Toronto | ON | Reefer | 509 | 799 |
| Laredo | TX | Calgary | AB | Van | 236 | 737 |
| McAllen | TX | Mississauga | ON | Van | -17 | 293 |
| Montreal | QC | Calgary | AB | Van | 84 | 63 |
| Prince George | BC | Calgary | AB | Van | 65 | 63 |
| Winnipeg | MB | Atlanta | GA | Reefer | – | 60 |
Outbound Cross-border Activity
Outbound loads from Canada to the United States fell slightly by two percent from last month and were down 34 percent from this time last year. Equipment postings increased by nine percent from December and are up 37 percent year-over-year.
Inbound Cross-border Activity
Inbound loads rose significantly by 52 percent compared to December but were down 27 percent on a year-over-year basis. Equipment postings were down nine percent from last month but up 51 percent from last January.
Intra-Canadian Activity
Freight activity within Canada rose 11 percent in January, but load postings decreased by 16 percent year-over-year. Equipment postings increased seven percent month-over-month but were up 34 percent year-over-year.

Average Truck-to-Load Ratios
The truck-to-load ratio in January of 1.76 was 17 percent lower than the 2.13 trucks for every load posted in December. Year-over-year, January’s truck-to-load ratio was 89 percent higher than the extremely low ratio of 0.93 seen in January 2022.
About Loadlink Indexes
Freight Index data provides insight into Canada’s economy at large and is a primary resource for the trucking community. The Freight Index accurately measures trends in the truckload freight spot market as its components are comprised of roughly 7,500 Canadian carriers and freight brokers. This data includes all domestic and cross-border data submitted by Loadlink customers and thus is considered a real-time pulse of what’s happening in the North American freight industry.
Rate Index data is based on the average spot rates paid by freight brokers and shippers to carriers in the specific lanes where loads are hauled. This data also shows real-time and historically available capacity as well as total truck-to-load ratios.
About Loadlink Technologies
Loadlink Technologies moves Canada’s freight by matching trucks with loads. With 30 years of freight matching experience, Loadlink delivers a reliable technology, data, and analytics ecosystem to keep Canadian freight moving. Loadlink is trusted by transportation companies and brokers of all shapes and sizes and is proudly the industry’s largest and most efficient digital freight network.

