
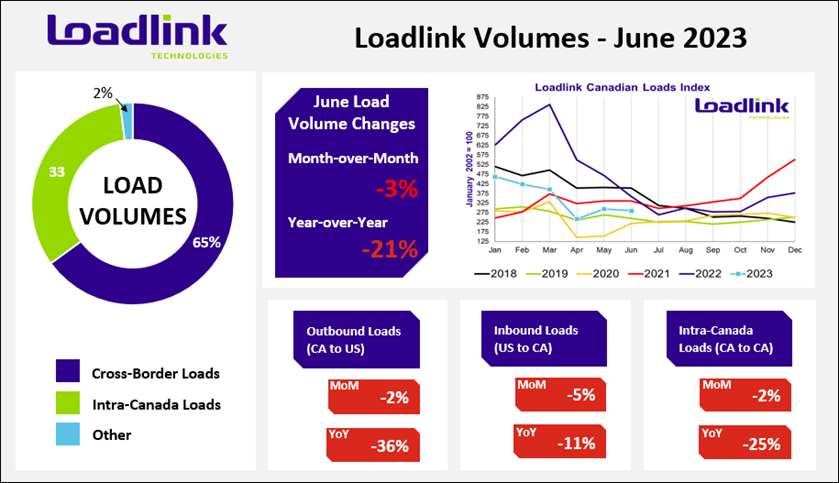
TORONTO – Loadlink Technologies’ Canadian spot market saw very little change in June as truck and load posting volumes remained relatively stable, with just minor load and equipment postings declines. While equipment availability continues at new highs, load postings show consistent, stable performance entering the summer season. Year-over-year comparisons remain tough but are correcting as the comparison period in the upcoming third quarter will more accurately reflect similar, standard freight activity levels currently seen on Loadlink’s freight matching network.
June Spot Freight Highlights
Calgary was a high-performing inbound market in June with noticeable improvements across several lanes stemming across the country, which included freight from cities like Mississauga (van/reefer), Montreal (reefer), Delta (van) and Edmonton (flatbed).

Outbound Cross-border Activity
Outbound loads from Canada to the United States fell slightly by four percent from last month but were down 36 percent from last year. Equipment postings dropped by two percent from May but were up 35 percent year-over-year.
Inbound Cross-border Activity
Inbound loads saw nearly no change, with just a single percent jump decline in postings in June compared to May and were only down 11 percent year-over-year. Equipment postings decreased five percent from last month but increased 19 percent year-over-year.
Intra-Canadian Activity
Freight activity within Canada fell by six percent in June following a slightly rebound in May, while year-over-year comparisons saw a 25 percent decline. Equipment postings saw little change, with just a two percent decrease consistent but was still up 25 percent year-over-year.
Average Truck-to-Load Ratios
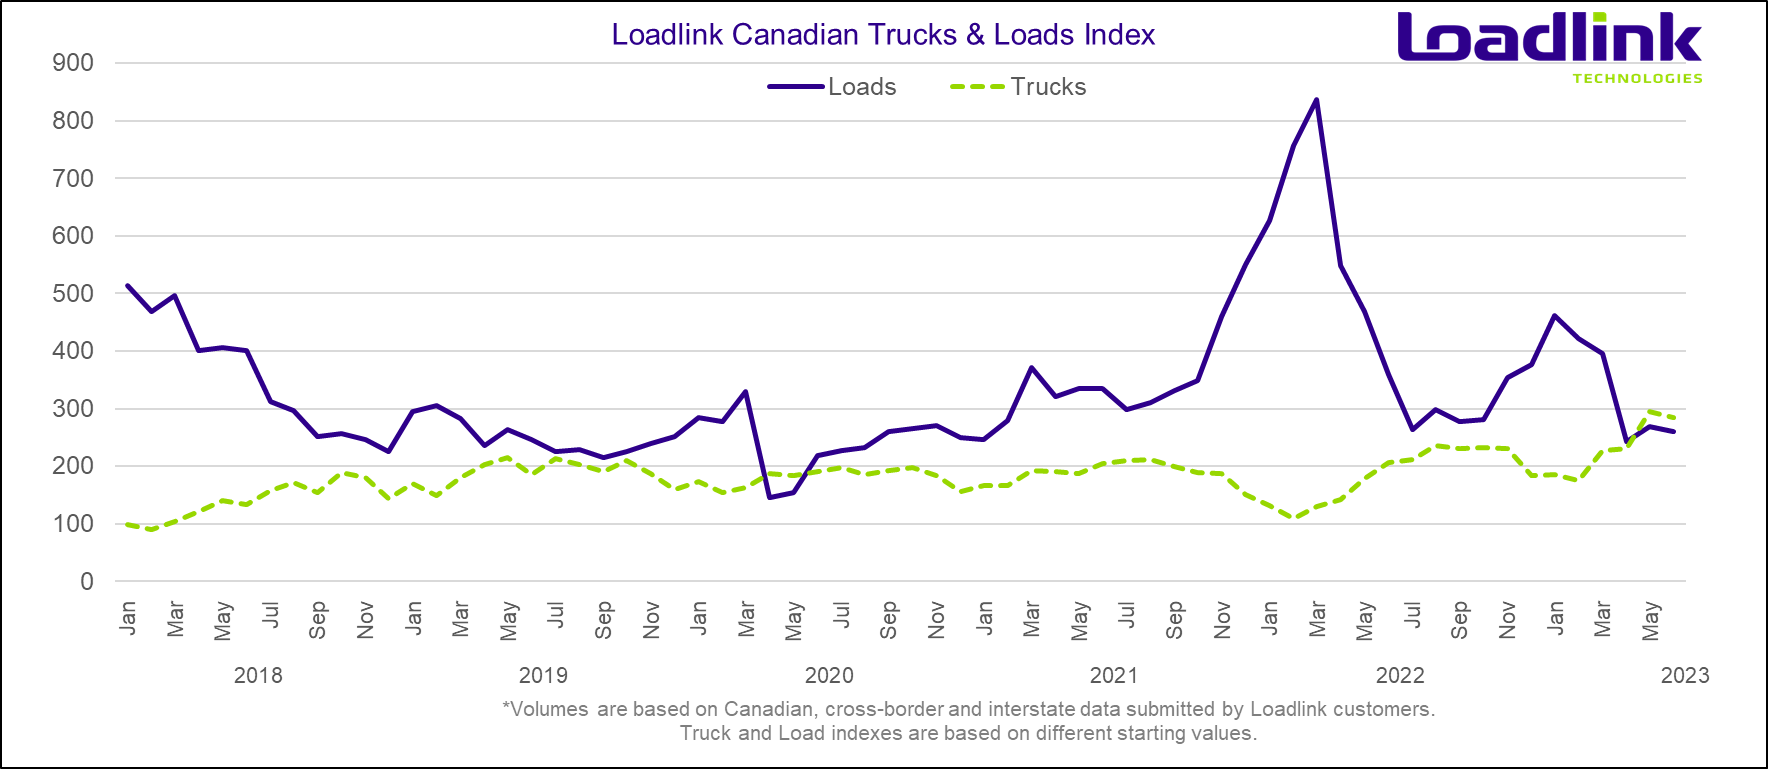
The truck-to-load ratio in June was 4.01 trucks for every load posted on Loadlink. The ratio for last month was 4.00 available trucks for every load posted, which meant June’s ratio increased by less than a full percentage point. Year-over-year, the truck-to-load ratio increased by 59 percent compared to a ratio of 2.53 in June 2022.
About Loadlink Indexes
Freight Index data provides insight into Canada’s economy at large and is a primary resource for the trucking community. The Freight Index accurately measures trends in the truckload freight spot market as its components are comprised of roughly 7,750 Canadian carriers and freight brokers. This data includes all domestic and cross-border data submitted by Loadlink customers and thus is considered a real-time pulse of what’s happening in the North American freight industry.
Rate Index data is based on the average spot rates paid by freight brokers and shippers to carriers in the specific lanes where loads are hauled. This data also shows real-time and historically available capacity as well as total truck-to-load ratios.
About Loadlink Technologies
Loadlink Technologies moves Canada’s freight by matching trucks with loads. With 30 years of freight matching experience, Loadlink delivers a reliable technology, data, and analytics ecosystem to keep Canadian freight moving. Loadlink is trusted by transportation companies and brokers of all shapes and sizes and is proudly the industry’s largest and most efficient digital freight network.