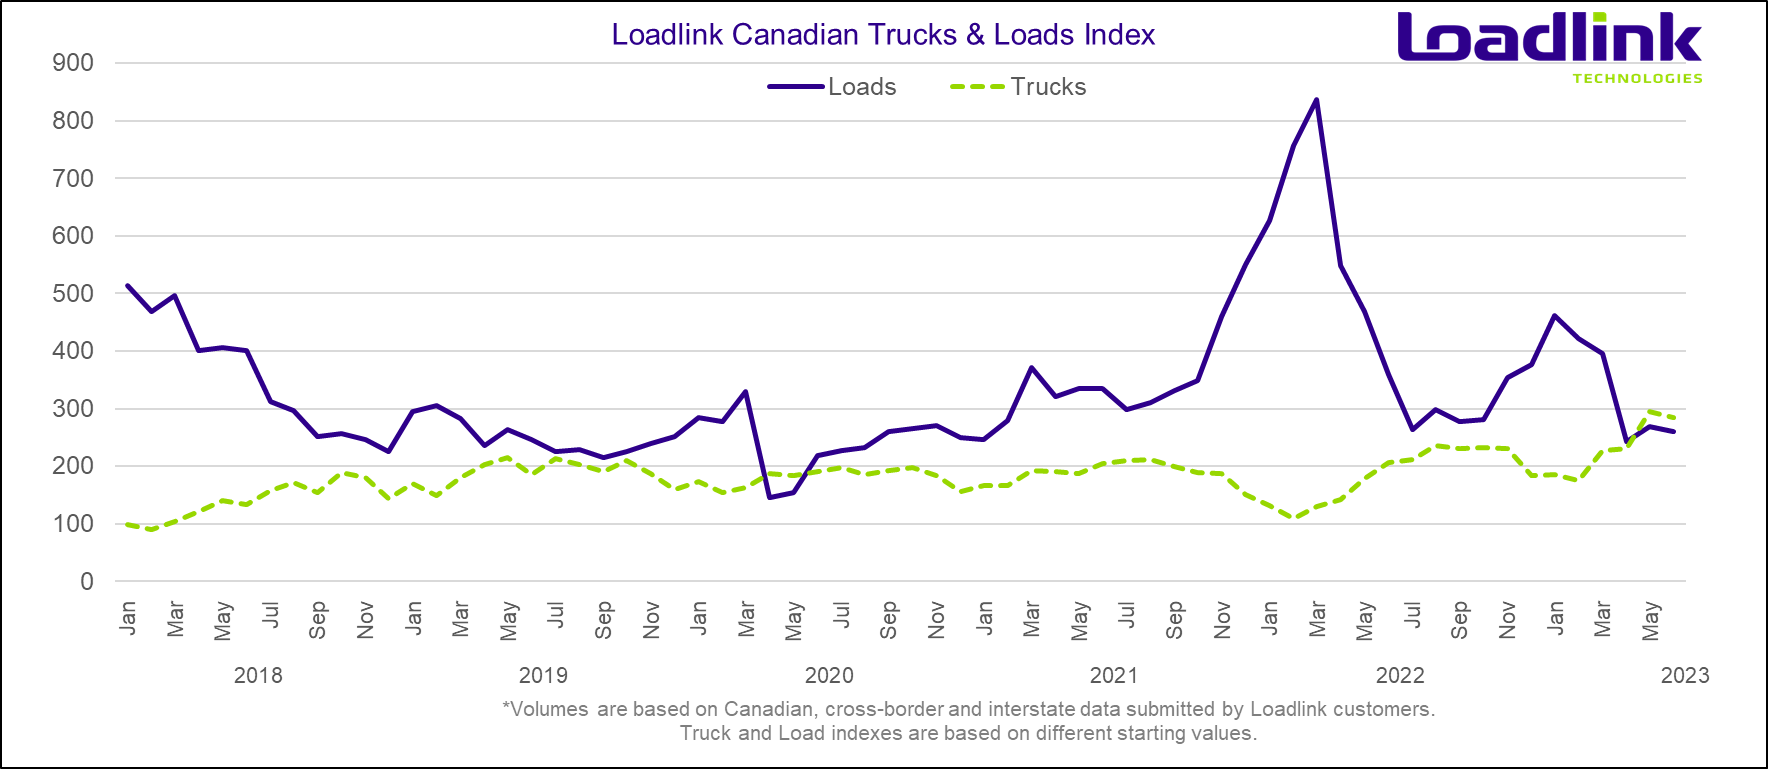
TORONTO – Loadlink Technologies’ Canadian spot market saw the usually slower summer season mark its impact as freight and truck volumes saw a 20 percent decline from June to July. Load volumes in July were almost identical to those in July 2019 and 2020, so freight activities aligned with seasonal expectations.
Freight movement across the US and Canada saw a significant seasonal shift as cross-border loads in June comprised 65 percent of total postings but fell to just 58 percent in July. This shift resulted from a decrease in 42 percent of inbound loads entering Canada from the US, a trend that Loadlink has observed in past July’s. Despite fewer loads entering Canada, outbound loads originating from Canada and entering the US rose 11 percent, while intra-Canadian activity saw very little change from June.
July Spot Freight Highlights
In July, the Montreal market stood out as several top-performing city-to-city lanes originated from Montreal. Mississauga and Edmonton were popular inbound destinations, with many of the best-performing lanes ending in these markets.
|
Origin City |
Origin State |
Destination City |
Destination State |
Vehicle |
YoY (%) |
MoM (%) |
|
Montreal |
QC |
Surrey |
BC |
Van |
442 |
411 |
|
Montreal |
QC |
Mississauga |
ON |
Reefer |
68 |
127 |
|
Montreal |
QC |
Dartmouth |
NS |
Van |
62 |
118 |
|
Montreal |
QC |
Toronto |
ON |
Reefer |
-9 |
103 |
|
Brampton |
ON |
Edmonton |
AB |
Van |
142 |
66 |
Outbound Cross-border Activity
Outbound loads from Canada to the United States improved, with an 11 percent increase from last month, but volumes were down 14 percent from last year. Equipment postings also fell monthly by 10 percent from June but increased 21 percent year-over-year.
Inbound Cross-border Activity
Inbound loads entering Canada from the US saw the most significant decline, with a hefty 42 percent decrease from June, while year-over-year, the reduction was limited to just an 18 percent drop. Equipment postings rose slightly by seven percent from last month but increased by 16 percent year-over-year.
Intra-Canadian Activity
Freight activity within Canada saw little change from June, with just a minor two percent dip in load volumes but saw a higher decrease of 12 percent from July 2022. Equipment postings also saw a small change, with a six percent decline from last month but was still up 19 percent year-over-year.

Average Truck-to-Load Ratios
The truck-to-load ratio in July was 4.85 trucks for every load posted on Loadlink. The ratio for last month was 4.01 available trucks for every load posted, which meant July’s ratio increased by 21 percent. Year-over-year, the truck-to-load ratio increased by 38 percent compared to 3.51 in July 2022.
About Loadlink Indexes
Freight Index data provides insight into Canada’s economy at large and is a primary resource for the trucking community. The Freight Index accurately measures trends in the truckload freight spot market as its components are comprised of roughly 7,750 Canadian carriers and freight brokers. This data includes all domestic and cross-border data submitted by Loadlink customers and thus is considered a real-time pulse of what’s happening in the North American freight industry.
Rate Index data is based on the average spot rates paid by freight brokers and shippers to carriers in the specific lanes where loads are hauled. This data also shows real-time and historically available capacity as well as total truck-to-load ratios.
About Loadlink Technologies
Loadlink Technologies moves Canada’s freight by matching trucks with loads. With 30 years of freight matching experience, Loadlink delivers a reliable technology, data, and analytics ecosystem to keep Canadian freight moving. Loadlink is trusted by transportation companies and brokers of all shapes and sizes and is proudly the industry’s largest and most efficient digital freight network.

