
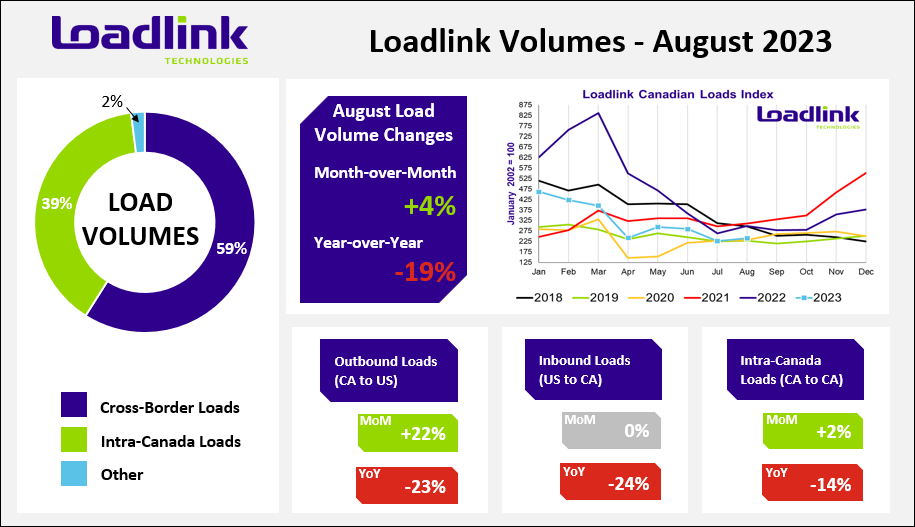
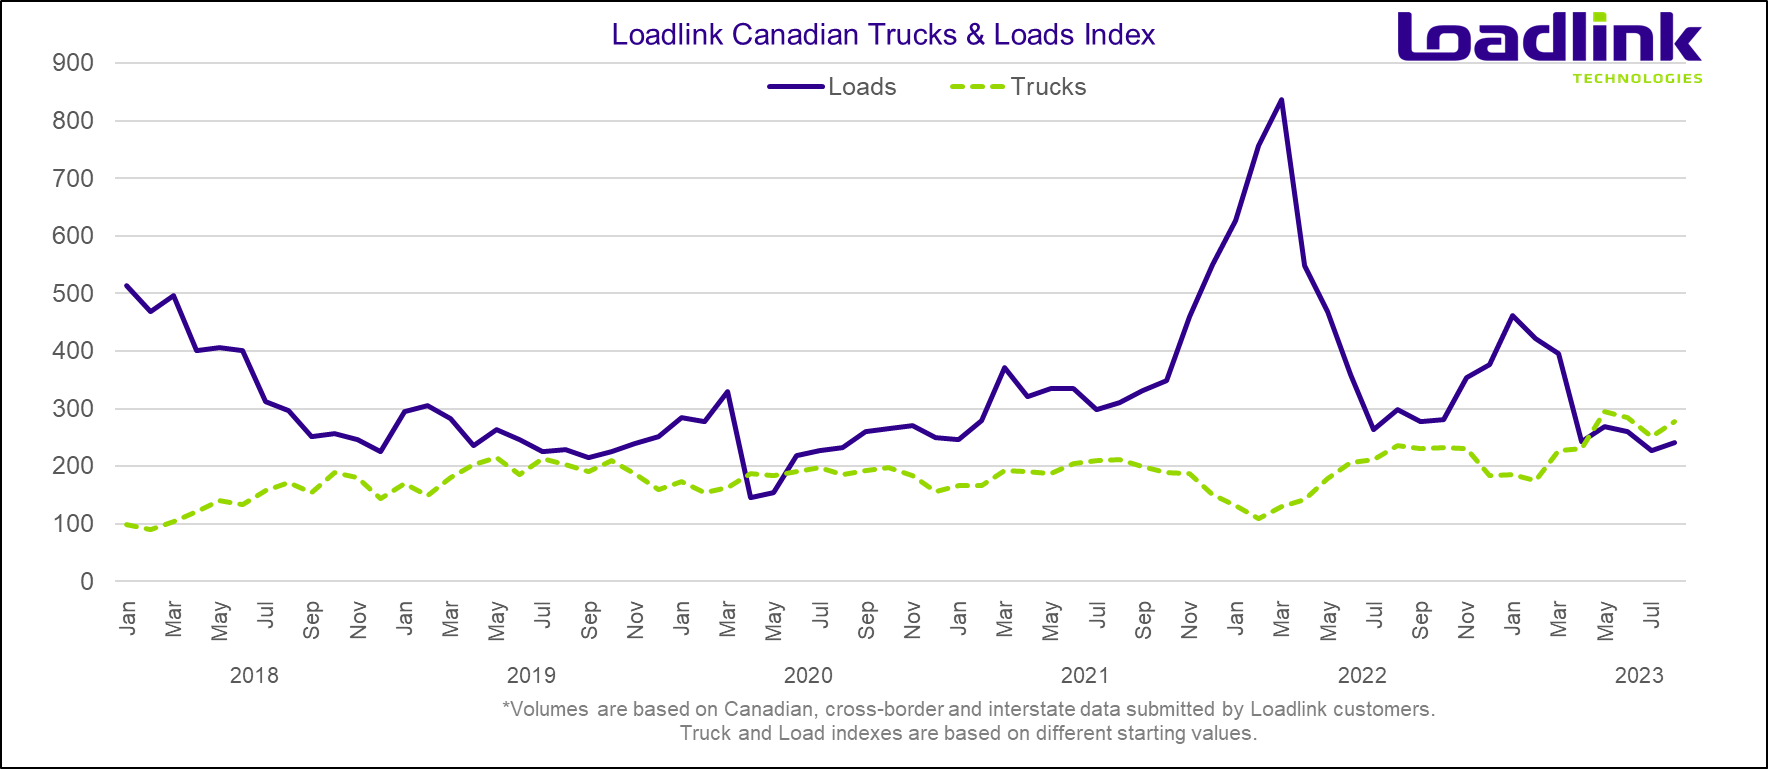
TORONTO – Loadlink Technologies’ Canadian spot market continued with its expected slower summer seasonal freight activity on a more positive note, with a four percent increase in load volumes in August from July. Equipment volumes continued to climb with 11 percent more postings, resulting in Loadlink’s highest recorded truck volumes in a single month, surpassing May of this year.
Freight movement across the US and Canada on Loadlink’s spot market saw overall positive gains. While outbound freight movement remained stable and intra-Canadian load postings saw slight increases, inbound activity jumped and contributed to improved freight performance in August.
August Spot Freight Highlights
Several popular intra-Canadian and inbound reefer lanes saw substantial improvements in August loads, coinciding with the greater need for temperature-controlled units during the hottest summer months recorded in North America.
| Origin City | Origin State | Destination City | Destination State | Vehicle | YoY(%) | MoM(%) |
| Montreal | QC | Ottawa | ON | Reefer | 358 | 223 |
| Surrey | BC | Winnipeg | MB | Van | 12 | 219 |
| Mississauga | ON | Moncton | NB | Reefer | -23 | 111 |
| Toronto | ON | Montreal | QC | Reefer | 15 | 84 |
| Edmonton | AB | Surrey | BC | Reefer | 52 | 53 |
| Salinas | CA | Toronto | ON | Reefer | 591 | 45 |
Outbound Cross-border Activity
Outbound loads from Canada to the United States saw notable improvement, with 22 percent more loads than in July, but volumes were down 23 percent from last year. Equipment postings rose slightly by five percent from July but rose 22 percent year-over-year.
Inbound Cross-border Activity
Inbound load volumes entering Canada from the US in August were flat and saw no change in load postings from last month. Year-over-year, load volumes fell 24 percent. Equipment postings rose by 15 percent from July and increased by 12 percent compared to August 2022.
Intra-Canadian Activity
Once again, freight activity within Canada saw little change, with a two percent rise in load postings month-over-month, while volumes decreased 14 percent year-over-year. Equipment postings increased monthly and year-over-year with an 11 and 18 percent change, respectively.
Average Truck-to-Load Ratios
The truck-to-load ratio in August was 5.05 trucks for every load posted on Loadlink. The ratio for last month was 4.85 available trucks for every load posted, which meant August’s percentage increased by four percent. Year-over-year, the truck-to-load ratio increased by 45 percent compared to 3.48 in August 2022.
About Loadlink Indexes
Freight Index data provides insight into Canada’s economy at large and is a primary resource for the trucking community. The Freight Index accurately measures trends in the truckload freight spot market as its components are comprised of roughly 7,750 Canadian carriers and freight brokers. This data includes all domestic and cross-border data submitted by Loadlink customers and thus is considered a real-time pulse of what’s happening in the North American freight industry.
Rate Index data is based on the average spot rates paid by freight brokers and shippers to carriers in the specific lanes where loads are hauled. This data also shows real-time and historically available capacity as well as total truck-to-load ratios.
About Loadlink Technologies
Loadlink Technologies moves Canada’s freight by matching trucks with loads. With 30 years of freight matching experience, Loadlink delivers a reliable technology, data, and analytics ecosystem to keep Canadian freight moving. Loadlink is trusted by transportation companies and brokers of all shapes and sizes and is proudly the industry’s largest and most efficient digital freight network.