
Canadian Freight Index Highlights
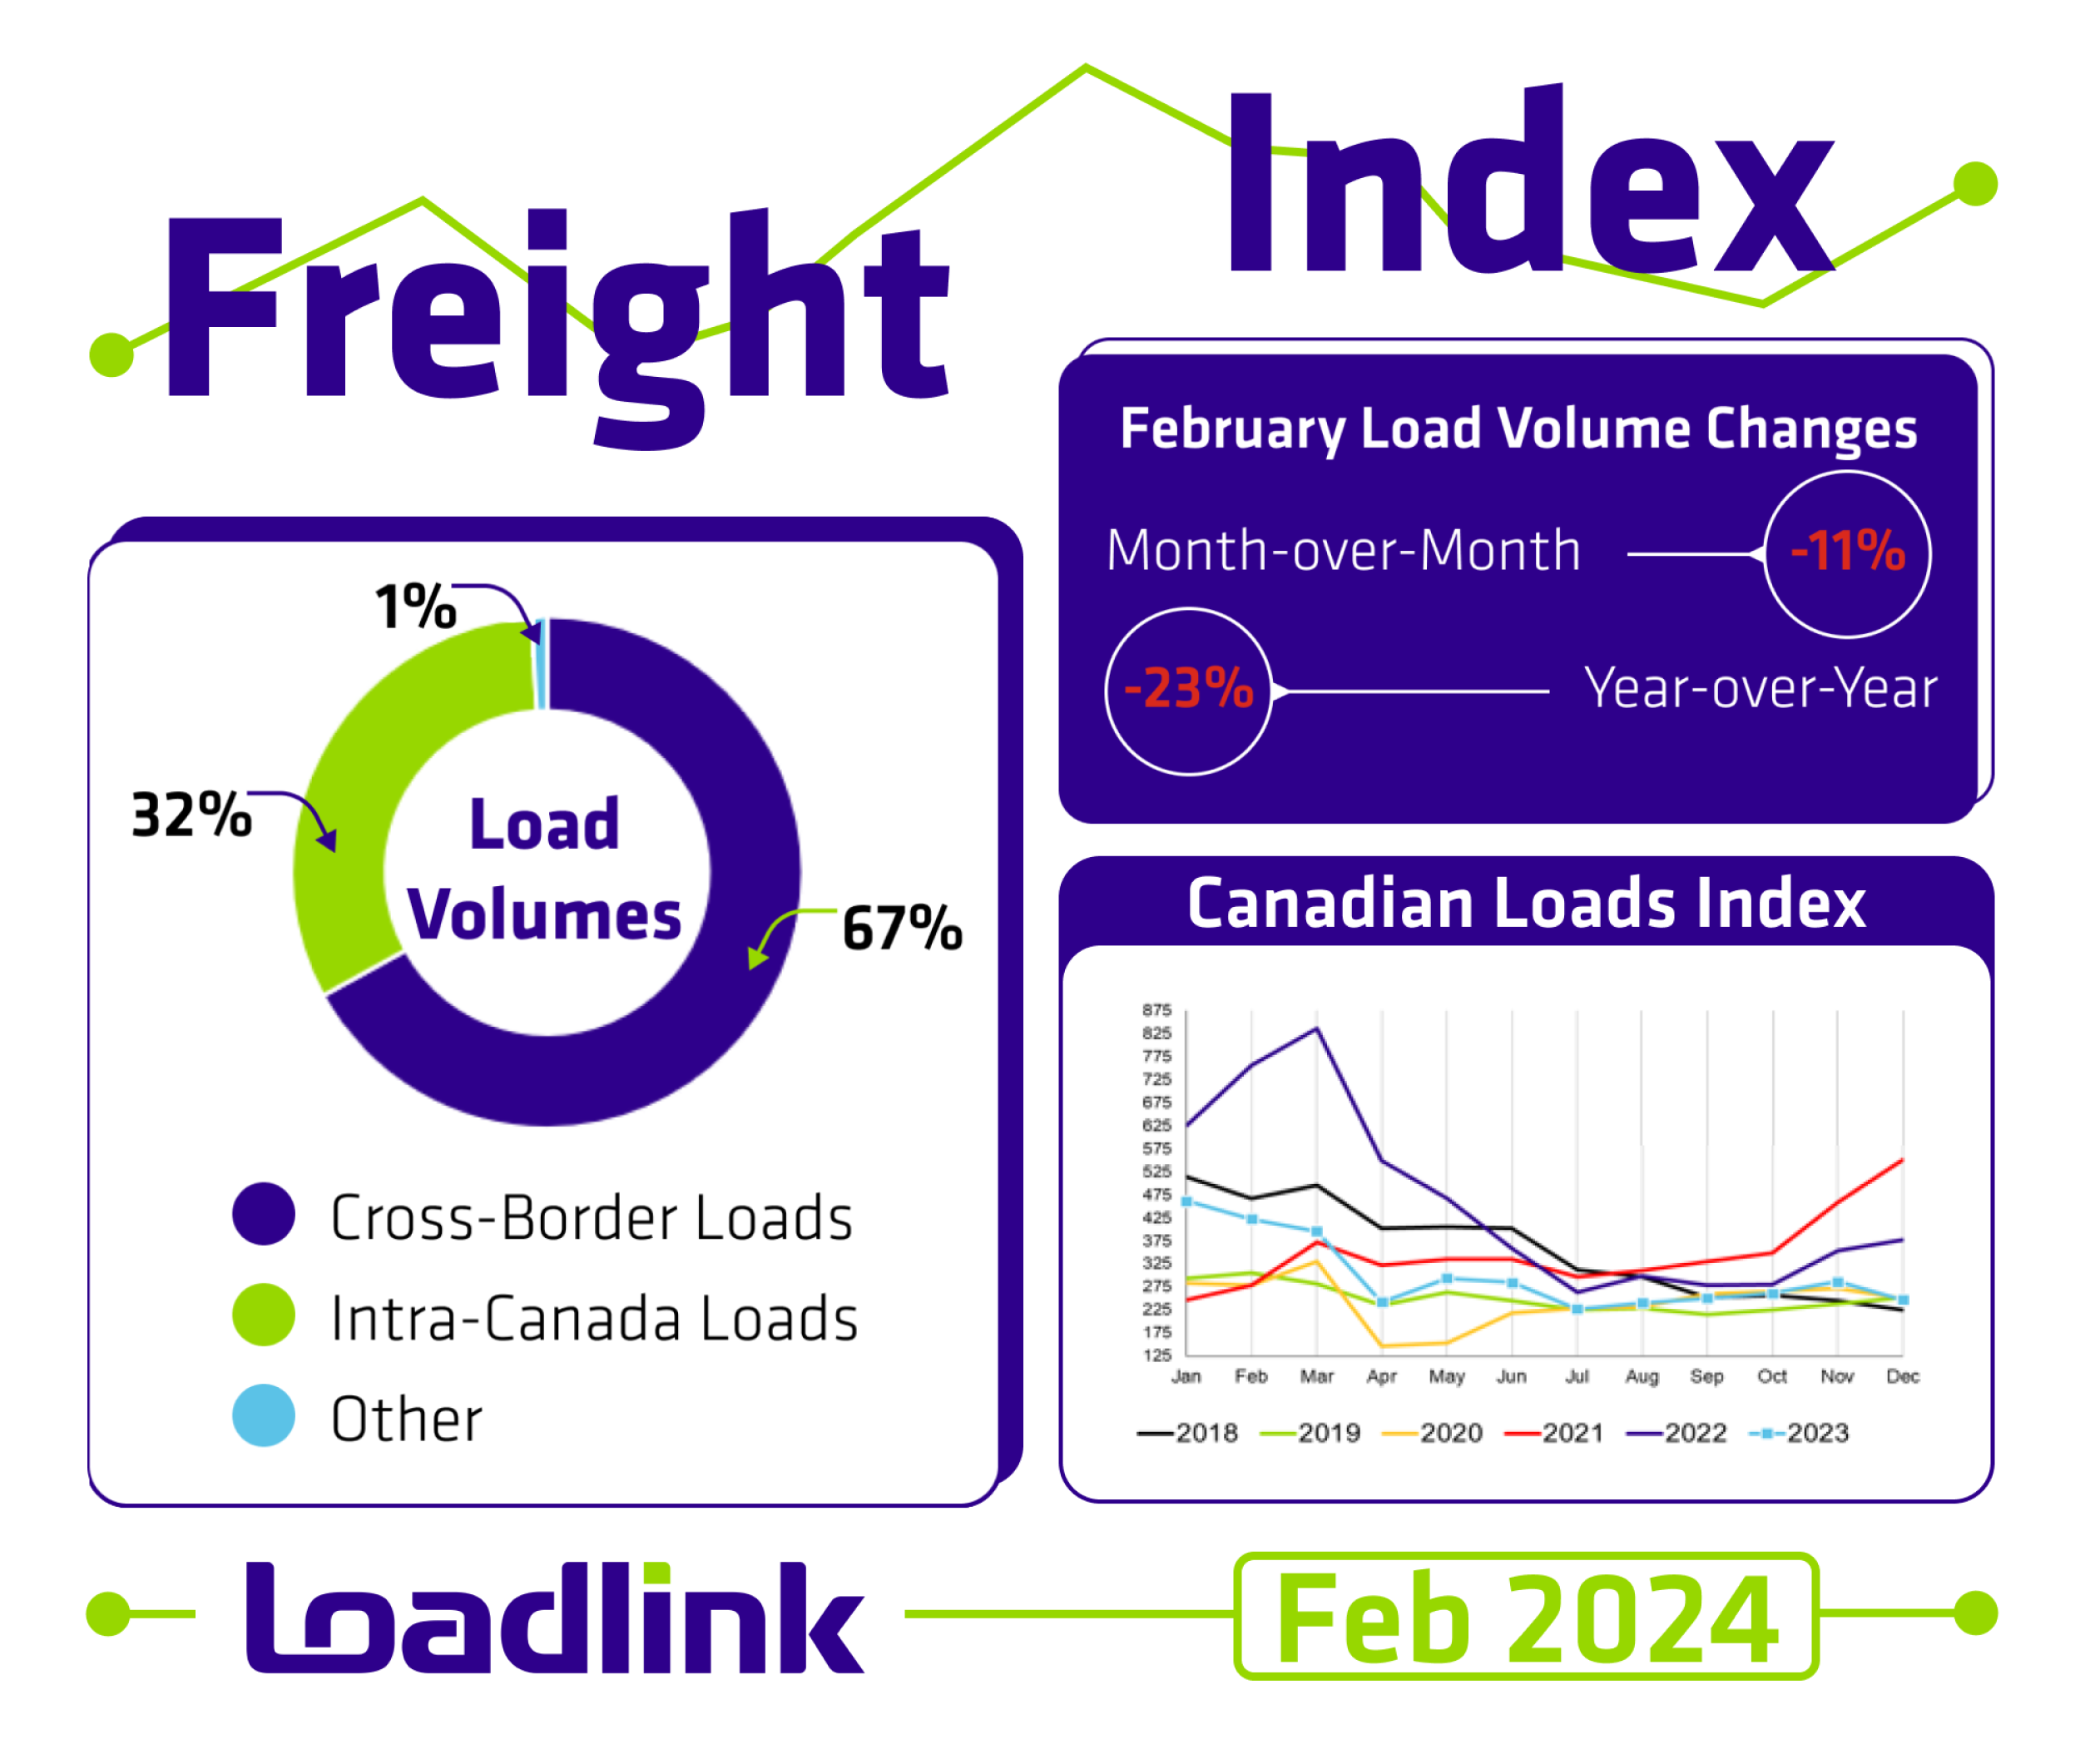
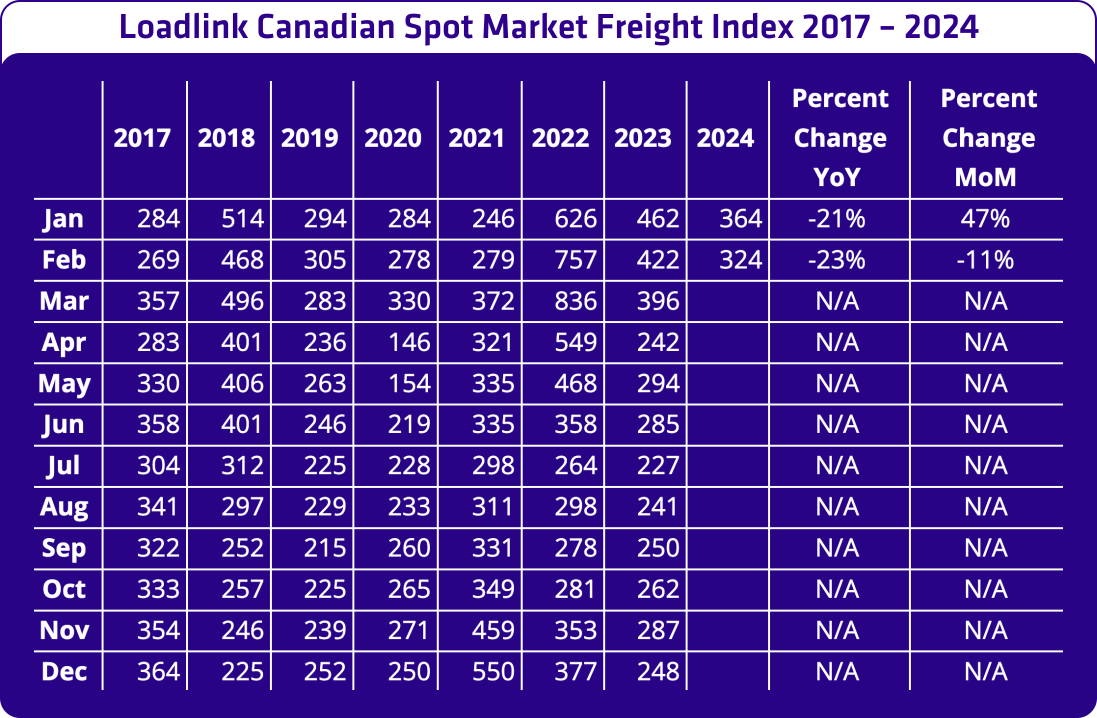
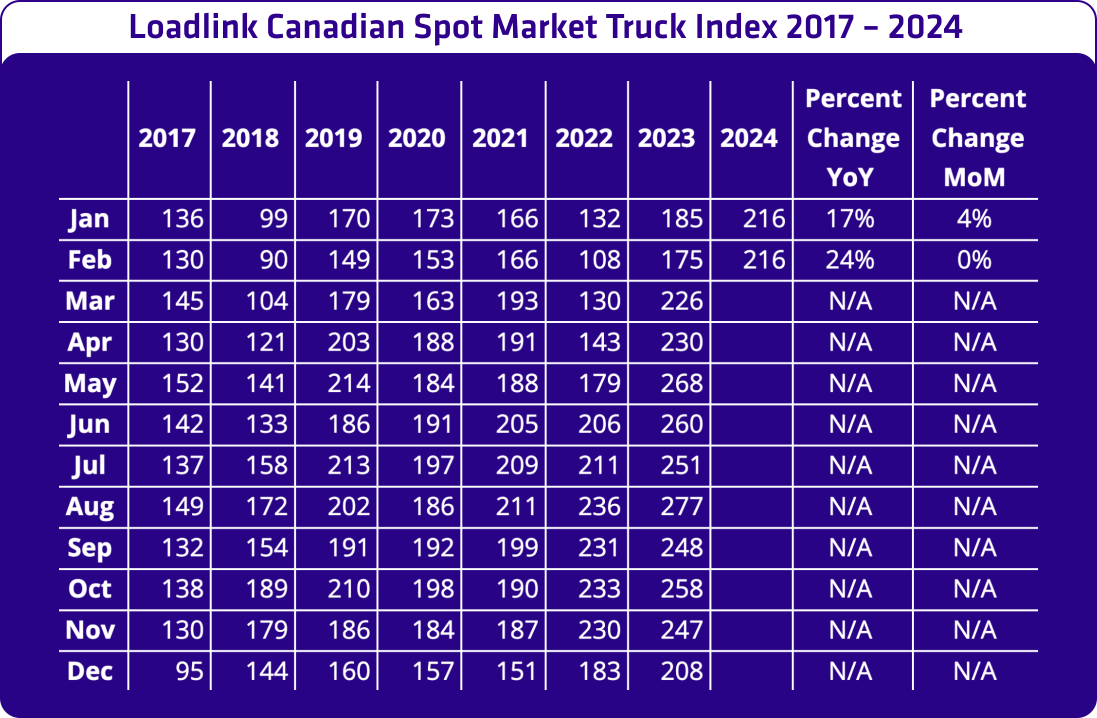
Month-over-month: Following a record-breaking January, February saw a natural 11% volume adjustment due to the shorter month, and family day holiday. This is expected after such a strong performance and with fewer shipping days. Load volumes remain well above the previous two quarters’ average.
Year-over-year: While volumes dipped slightly compared to February 2023, we’re encouraged to see them consistently surpassing typical summer, fall, and winter levels throughout 2023. This sustained growth compared to past seasonal trends is a positive indicator for the market’s overall health.
Load and Equipment Trends
Cross-Border: Cross-border load postings held strong, accounting for 67% of Canadian customer data. While both inbound and outbound loads decreased year-over-year, there’s a 19-22% increase in equipment availability for both directions.
Intra-Canada: Intra-Canadian postings, making up 32% of the data, experienced a minor 4% decline month-over-month. However, equipment postings within Canada are up year-over-year, indicating continued demand and carrier interest in domestic routes.
Equipment Breakdown: Our equipment postings continue to show a healthy mix, with Dry Vans leading the pack at 53%, followed by Reefers at 25%, Flatbeds at 18%, and Other at 4%. This diversity indicates strong demand across various equipment types, providing shippers with a wide range of options to meet their specific needs.
Additional Data
Outbound Cross-border Activity
Outbound Cross-border activity saw a small 2% decrease in loads compared to January, alongside a modest 3% equipment posting decline. This suggests the market is fine-tuning to meet current demand levels, which creates an optimal environment for both brokers and carriers.
Inbound Cross-border Activity
Inbound loads entering Canada dipped 20% from last month, while equipment postings remained nearly flat. This stability signifies continued carrier interest in servicing these routes.
Intra-Canadian Activity
Intra-Canadian activity saw a 4% month-over-month decline in loads and year-over-year volumes are down by 31%. Equipment postings within Canada increased 3% month-over-month and 29% year-over-year.
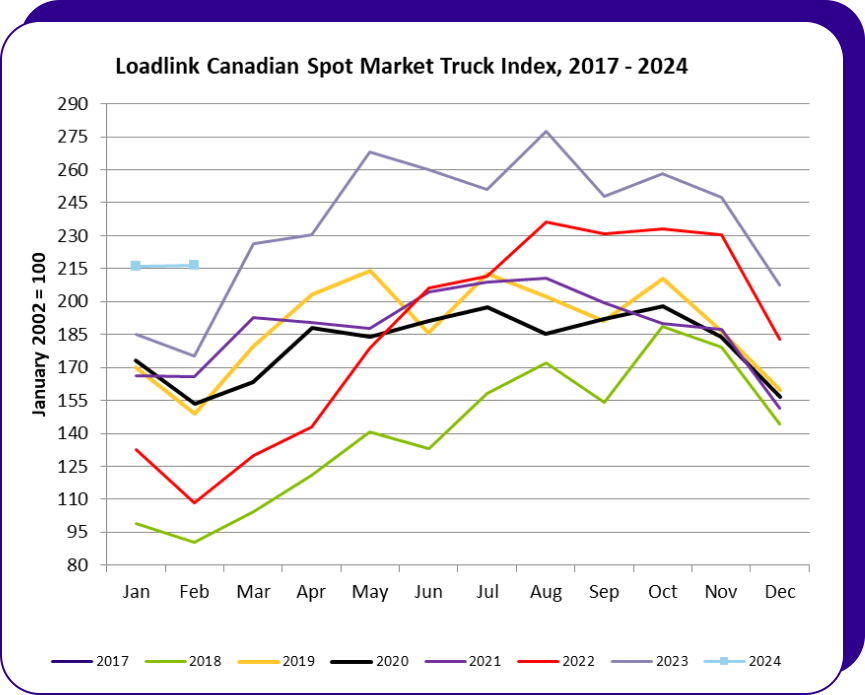
Average Truck-to-Load Ratios
February witnessed a continued rise in carrier capacity on Loadlink. The truck-to-load ratio increased 13% compared to January, reaching 2.69 trucks for every load posted.
About Loadlink Technologies: Loadlink Technologies moves Canada’s freight by matching trucks with loads. With over 30 years of freight matching experience, Loadlink delivers a reliable technology, data, and analytics ecosystem to keep Canadian freight moving. Loadlink is trusted by transportation professionals and brokers of all shapes and sizes and is proudly the industry’s largest and most efficient digital freight network.
Loadlink’s Posting Index offers detailed analytics to monitor and analyze trends in the freight market. It delivers valuable insights into trucking service demand by quantifying supply and demand across different regions and for various types of equipment. This index serves as a crucial tool for carriers, brokers, and logistics professionals, enabling them to assess changes in freight capacity, spot emerging trends, and make well-informed decisions.
Stay updated on positive industry news and insights by following Loadlink Technologies on Facebook, LinkedIn, Twitter, Instagram, and TikTok.
Note: All statistics mentioned are based on Loadlink’s comprehensive Freight Index data.