Unprecedented load volumes and strong recovery in equipment numbers helped to meet heavy demand.
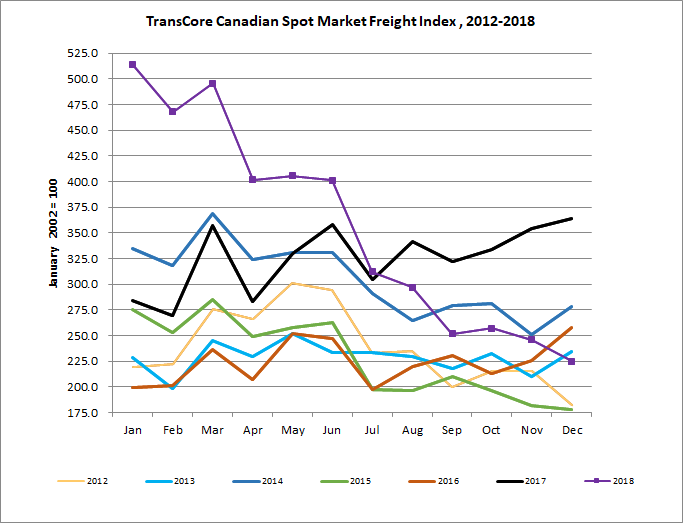
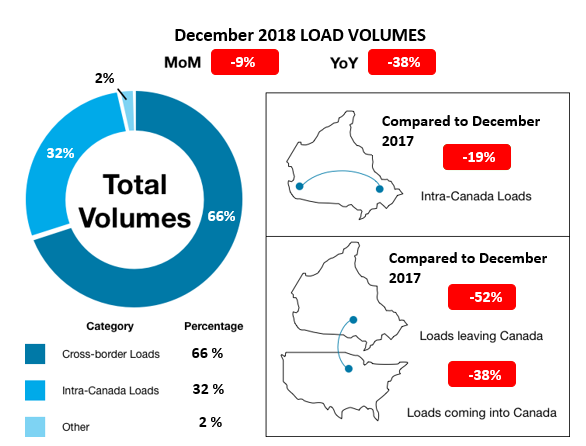
TORONTO –TransCore Link Logistics concluded its fourth quarter of 2018 with its lowest load volumes of the year, while truck volumes set a new record for the quarter. Fourth quarter load volumes were down 31 percent when compared to the fourth quarter of 2017 and down 15 percent compared to the third quarter of 2018.
Prior to the holidays, December load volumes performed very well with numbers resembling those in July when capacity was at a healthier level. Declines in both truck and load availability were expected at the end of December. With three fewer shipping days compared to November, December’s load postings declined nine percent compared to the previous month; yet the daily average number of postings actually increased six percent.
2018 FREIGHT VOLUME RESULTS HIGHLIGHTED:
- The highest load volumes for the year were in January and the lowest were in December. January’s load volumes were also the highest in Loadlink’s history.
- Monthly volumes from January to July were the highest ever recorded in each of those months.
- The most significant month-over-month increase took place in January, which was 41 percent higher than December 2017.
- The most significant year-over-year increase also took place in January, which was 81 percent higher than January 2017.
- Year-over-year, the total load volumes averaged a 10 percent increase compared to the total average volumes in 2017.
Equipment Performance
In contrast to the volumes of freight activity in 2018, equipment postings experienced a steady incline as the year progressed. January equipment volumes were at its lowest levels since 2005 but surged upwards with both October and November posting the two highest monthly equipment volumes since Loadlink began tracking this data. The highest equipment volumes were in November and the lowest equipment volumes were in February.
December’s equipment postings declined 20 percent when compared to November and increased 52 percent when compared to December 2017. A decrease in December’s equipment postings is very typical for the month. In fact, there is no year on record for Loadlink that did not see a December decrease in equipment postings. This trend is in direct correlation to reduced driver availability as many take the time to be with their family during the holidays.
Truck-to-Load Ratio
In December, capacity tightened slightly to 2.82 from a competitive truck-to-load ratio of 3.20 in November. The year began with a very carrier-favoured ratio of approximately one truck for every one load posted on Loadlink. This ratio remained relatively stable until the second quarter of 2018 where capacity began expanding due to a recovery in truck volumes coupled with decreasing load availability. This expansion in capacity continued until October where it reached a peak of 3.22 for the year but has tightened since then.
Industry impact on Truckload Capacity for Spot Market
2018’s initial tight capacity levels were due a combination of decreased driver availability following new ELD mandates and hours of service enforcement introduced in late 2017, as well as an immense uptick in load volumes. As equipment numbers recovered, load volumes declined. This may have been due to a decreased reliance on the spot market by shippers and brokers as they moved towards contract-work during a period when securing trucks was difficult.
Carriers were happy to settle outside the spot market as rates were already very enticing while shippers and brokers would have wanted to lock in rates before spot rates increased yet again, causing more contracts to be tendered. New tariffs and international trade uncertainties most likely contributed to the drastic drop in load postings mid-year. Year-over-year, the truck-to-load ratio expanded from 1.14 in December 2017 to 2.82 in December 2018.
Spot Rates
Canadian van rates experienced steady growth entering into the year but stabilized during the summer season once capacity had returned to regular levels. The rate in December was eight percent higher than it was in December 2017. Cross-border van rates on Loadlink underwent greater growth throughout the year as the December rate was 17 percent higher year-over-year. Hard enforcement of ELD adoption in the USA along with new tariffs would have affected rates more severely compared to intra-Canadian rates.


About TransCore Indexes
Truckload spot rates in specific areas can be accessed from TransCore’s Rate Index truckload rating tool Real-time and historical data on total truck and load volumes, as well as ratios in specific areas, can be accessed from TransCore’s Posting Index.
TransCore’s Canadian Freight Index accurately measures trends in the truckload freight spot market. The components of the Freight Index are comprised from roughly 6,300 of Canada’s trucking companies and freight brokers. This data includes all domestic, cross-border, and interstate data submitted by Loadlink customers.
About TransCore Link Logistics
Looking for a better way to match available freight loads with trucks, TransCore Link Logistics developed Loadlink in 1990. Loadlink is a load board connecting brokers, carriers, owner operators and private fleets in Canada to a real-time database of 18 million loads, shipments, and trucks – the largest in the industry.
The monthly Canadian Freight Index now defines the freight movement spot market. The company also provides its customers with dispatch solutions, ACE/ACI eManifest, Posting Index, Rate Index, credit solutions, factoring, online transportation job boards, mileage software, and more.
More information on TransCore Link Logistics can be found at www.transcore.ca, @loadlink on Twitter, on YouTube, Facebook and LinkedIn.
