
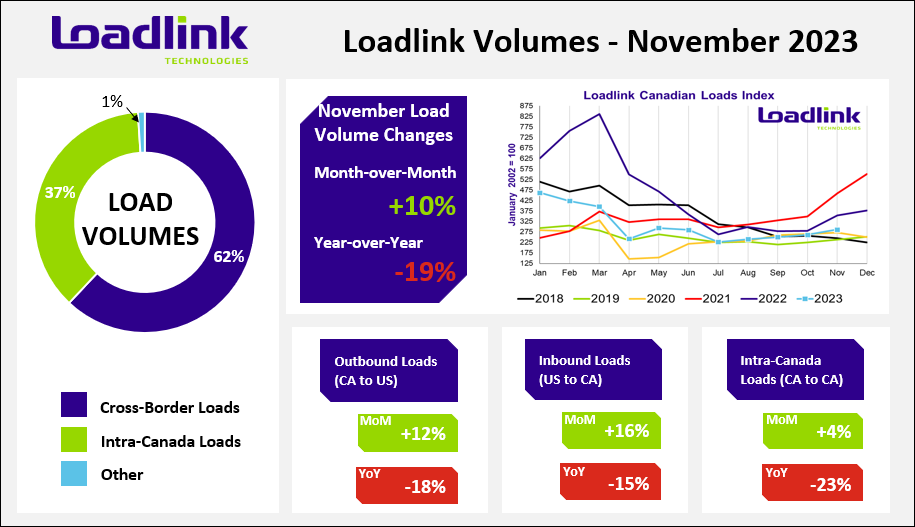
TORONTO – Loadlink Technologies’ Canadian spot market continued with its momentum from Q4 start last month with overall ten percent more load volumes, while the truck-to-load ratio tightened by 13 percent against lesser truck postings. Most of the gains in load volumes stemmed from improved cross-border performance both from outbound and inbound activity. Inbound loads led all areas with 16 percent more loads while outbound loads followed closely with 12 percent more loads.
Truck volumes declined as the winter season approached, but reefer postings were prevalent in some of the most popular city-to-city lanes in November as temperature control for freight plays a critical part during the colder weather.
November Spot Freight Highlights
| Origin City | Origin State | Destination City | Destination State | Vehicle | Year-on-year (%) | MoM(%) |
| Toronto | ON | Edmonton | AB | Van | 117 | 277 |
| Los Angeles | CA | Vancouver | BC | Van | 71 | 163 |
| Laredo | TX | Toronto | ON | Reefer | 52 | 138 |
| Calgary | AB | Winnipeg | MB | Reefer | -35 | 112 |
| Laredo | TX | Montreal | QC | Reefer | -13 | 72 |
| Los Angeles | CA | Vancouver | BC | Reefer | 158 | 56 |
Outbound Cross-border Activity
Outbound loads from Canada to the United States continued its strong performance in Q4 with 12 percent more load postings than October. Year-over-year, load volumes were down 18 percent from November 2022. Equipment postings saw some decline as the winter season approached with seven percent fewer trucks than in October but was up six percent from the same period last year.
Inbound Cross-border Activity
Inbound loads entering Canada saw the biggest gains in November with 16 percent higher volumes, while year-over-year, loads were still negative with 15 percent fewer postings than in 2022. Equipment postings fell by the same level as outbound activity with seven percent fewer trucks than in October and was virtually unchanged from 2022 with only a single percentage point increase in volumes.
Intra-Canadian Activity
Similar to last month, intra-Canadian activity saw very little change on a month-over-month basis with just four percent more loads and one percent more trucks than October. On a year-over-year basis, the difference was more noticeable as load volumes were still down 23 percent while truck postings were 14 percent higher in November 2022.
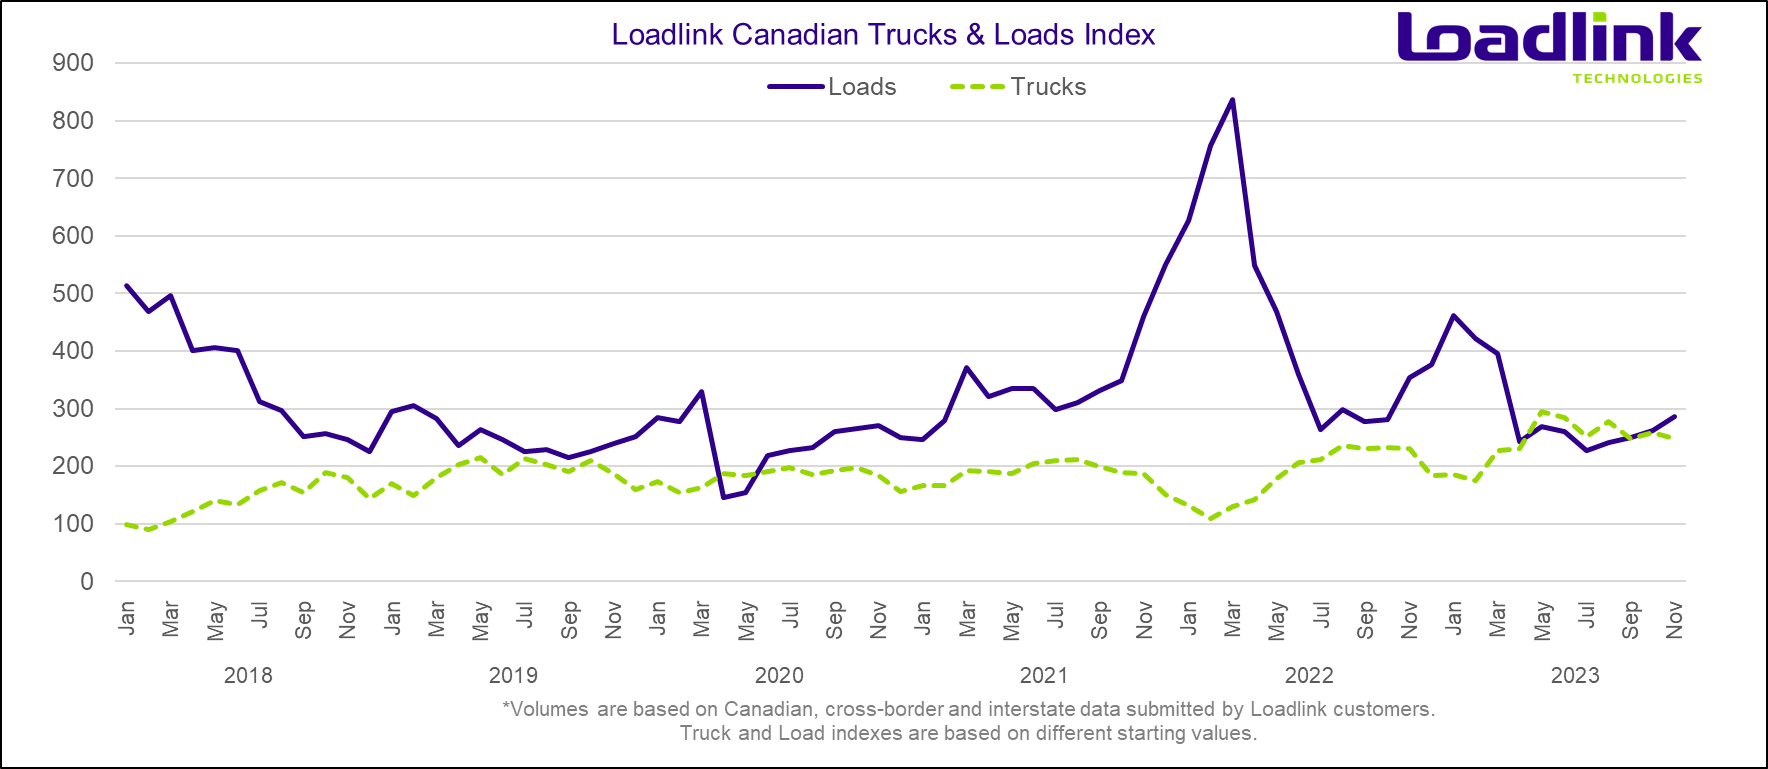
Average Truck-to-Load Ratios
The truck-to-load ratio in November was 3.78 trucks for every one load posted on Loadlink. The ratio for last month was 4.33 available trucks for every load posted, which meant November’s ratio decreased 13 percent from October’s value. Year-over-year, truck-to-load ratio increased by 32 percent compared to a ratio of 2.86 in November 2022.
About Loadlink Indexes
Freight Index data provides insight into Canada’s economy at large and is a primary resource for the trucking community. The Freight Index accurately measures trends in the truckload freight spot market as its components are comprised of roughly 7,750 Canadian carriers and freight brokers. This data includes all domestic and cross-border data submitted by Loadlink customers and thus is considered a real-time pulse of what’s happening in the North American freight industry.
Rate Index data is based on the average spot rates paid by freight brokers and shippers to carriers in the specific lanes where loads are hauled. This data also shows real-time and historically available capacity as well as total truck-to-load ratios.
About Loadlink Technologies
Loadlink Technologies moves Canada’s freight by matching trucks with loads. With 30 years of freight matching experience, Loadlink delivers a reliable technology, data, and analytics ecosystem to keep Canadian freight moving. Loadlink is trusted by transportation companies and brokers of all shapes and sizes and is proudly the industry’s largest and most efficient digital freight network.